Scrape & analyze data using google sheet in less than a minute

Web scraping is defined as the process to extract the data from web HTML pages and use it further for Data Analysis. So far I was using Python Scrapy, Beautiful Soup to extract the data online from web. I had been using Python libraries to extract the HTML table data from wikipedia or other sites for my analysis purpose, which means writing lines of code, cleaning the data and then using it for Analytics. if you are from programming background you might find it interesting to use Python or R for this, However Google Sheets have made all this process very simple to download from the web online in one click and further analyze and visualize.
In this article I’m going to scrape the data from wikipedia site and analyze it in Just 1 minute. Start the stopwatch:
Data for Analysis is Padma Vibhushan Awards, which is one of the highest civilian award given in the following field:
Literature & Education, Arts, Public Affairs, Trade & Industry, Social Work, Civil Service, Medicine, Science & Engineering, Sport
Wikipedia URL for the data:
https://en.wikipedia.org/wiki/List_of_Padma_Vibhushan_award_recipients
Now to import the data from this site to Google spreadsheet, We will use a simple one line formula to Imports data from a table or list within an HTML page.
IMPORTHTML(URL,Query,Index)
Check other functions also:
IMPORTFEED: Imports a RSS or ATOM feed.
IMPORTRANGE: Imports a range of cells from a specified spreadsheet.
IMPORTXML: imports data from any of various structured data types including XML, HTML, CSV, TSV, and RSS and ATOM XML feeds.
To scrape the data from the above URL, our above values for IMPORTHTML would be as follows:
URL: https://en.wikipedia.org/wiki/List_of_Padma_Vibhushan_award_recipients
Query: “table”
Index: 7
Select cell A1 and add the formula as shown in the figure below and press Enter Key and Magic!! the data is downloaded in the spreadsheet
IMPORTHTML(“https://en.wikipedia.org/wiki/
List_of_Padma_Vibhushan_award_recipients”,”table”,7)

Let’s find out the Awards given by Year from 1954-2017:
Select Column A in the sheet and Select Insert > Chart > Column Chart
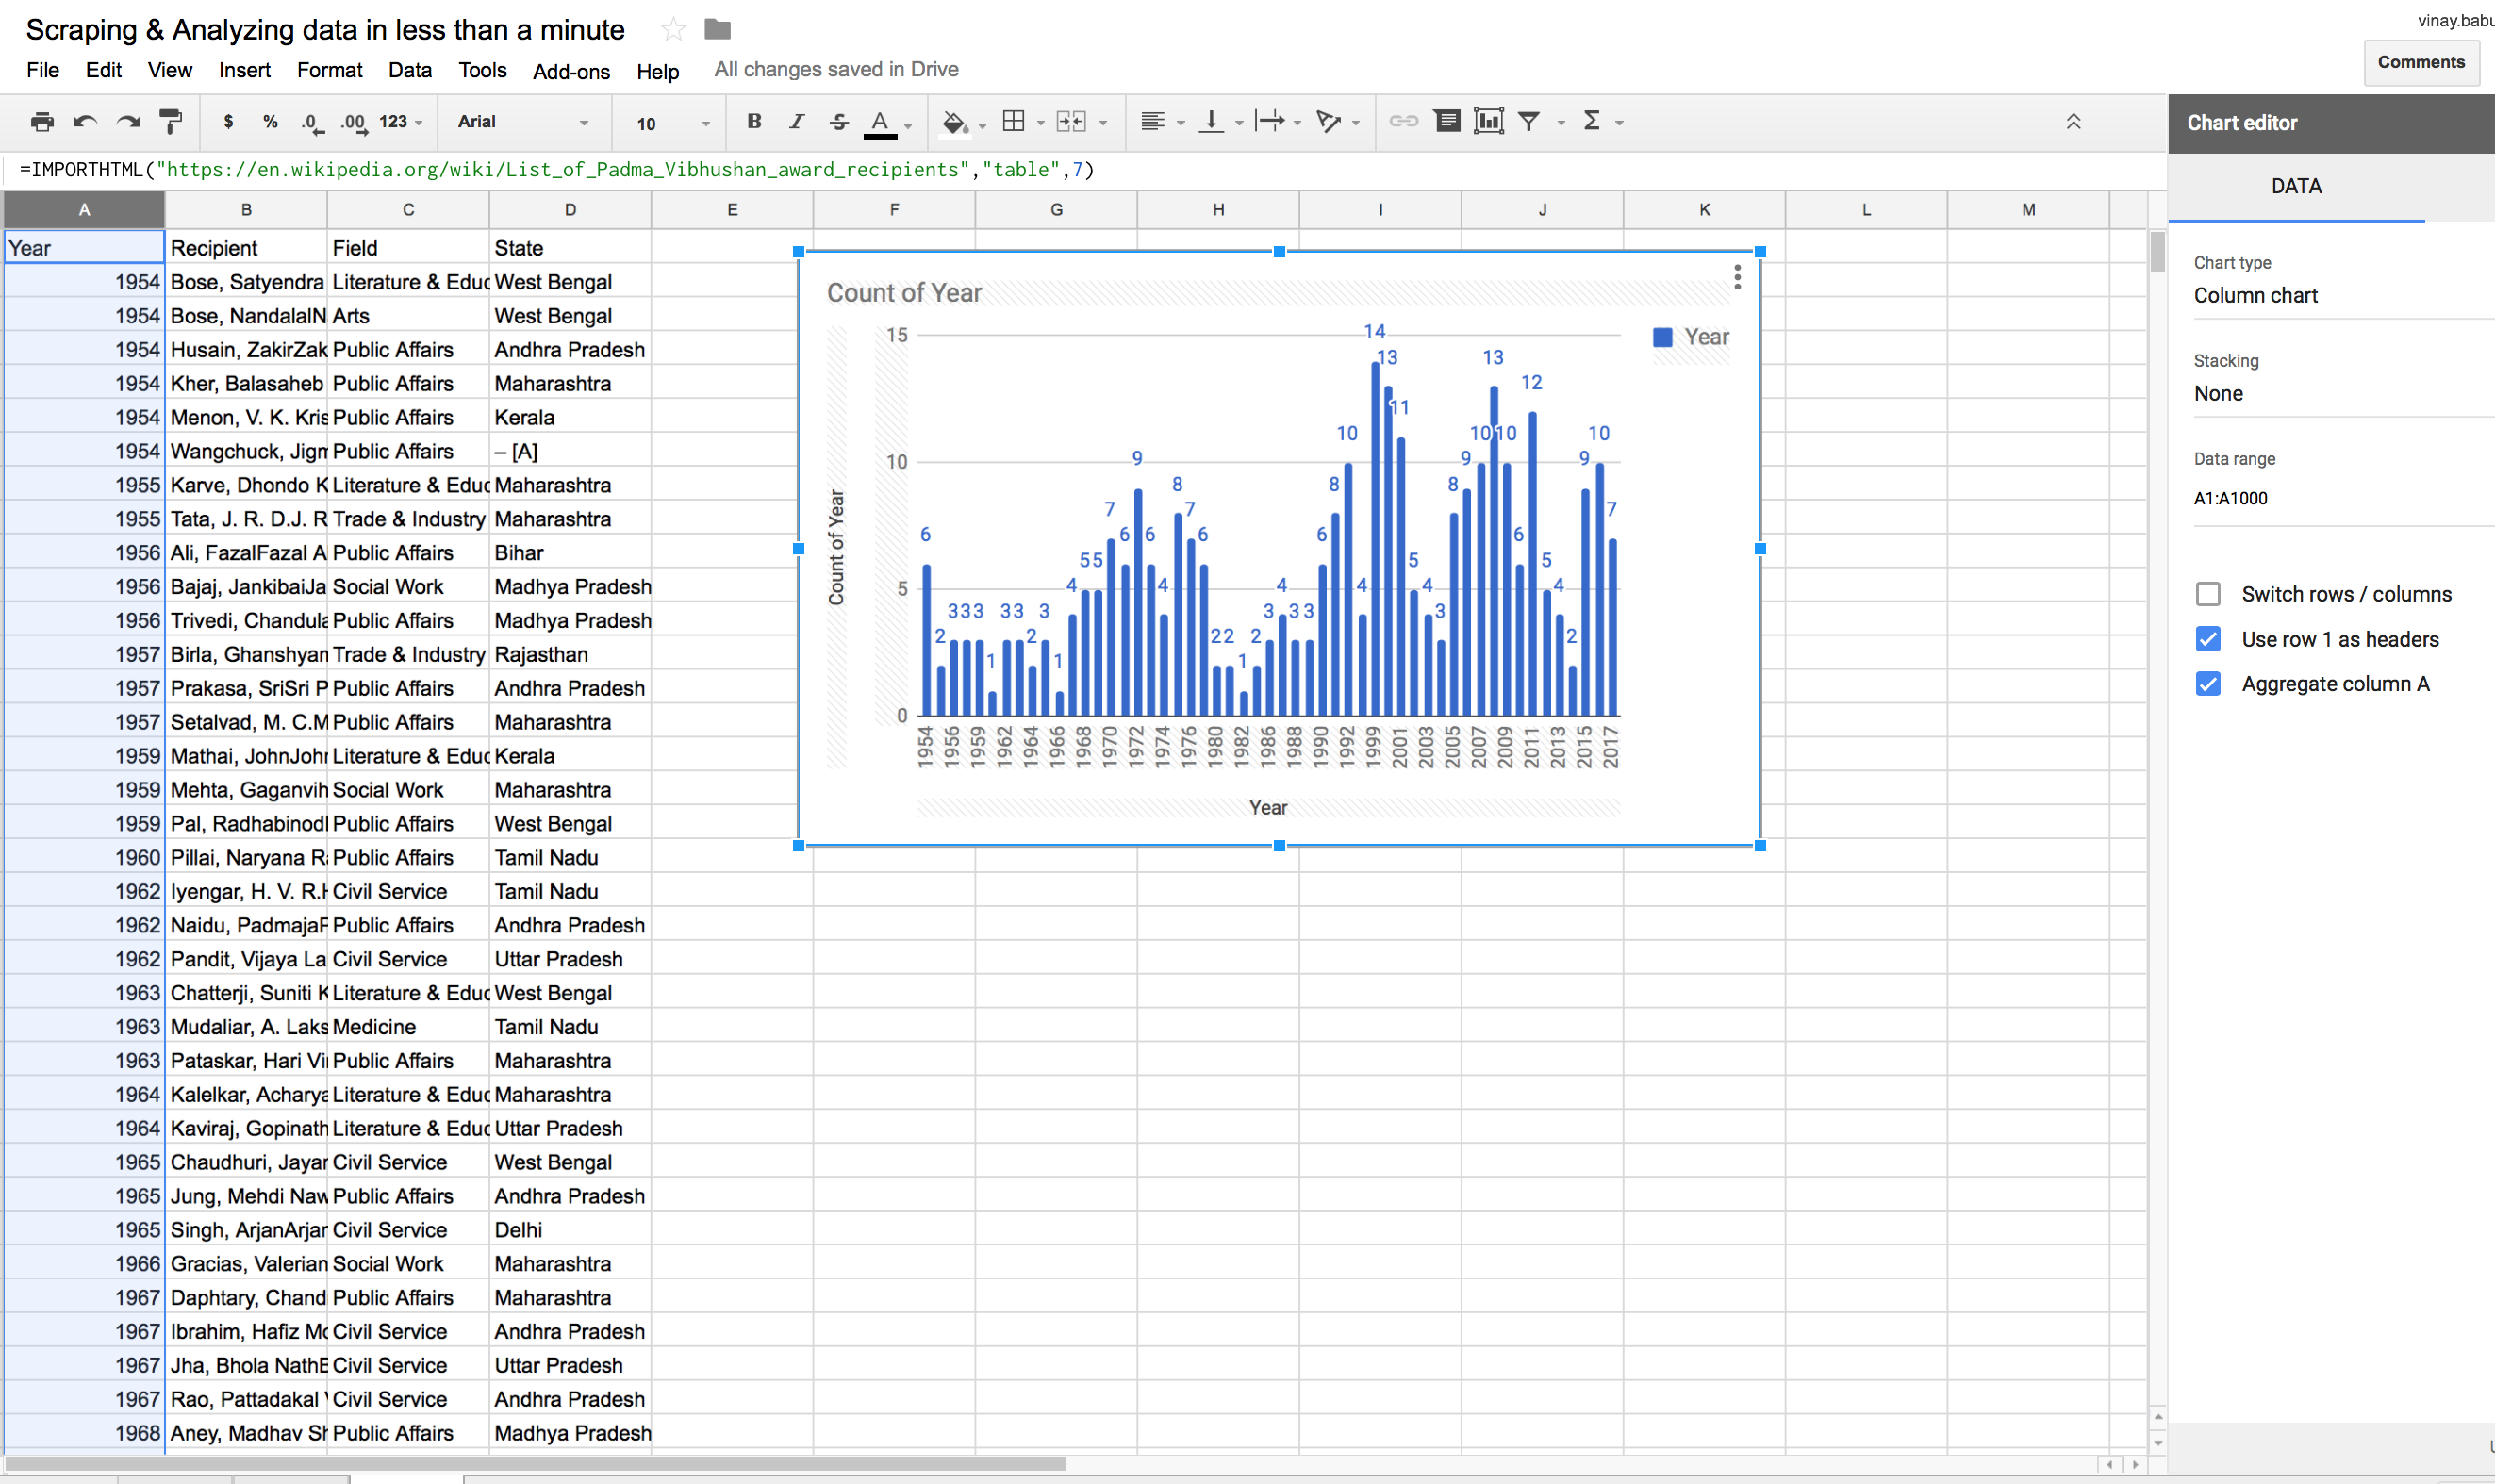
And your Beautiful Data Visualization is ready!!
Rest of the visualization and Dashboard I will explain in my next blog “Dashboarding with Google Spreadsheet”
Stop the watch and check the time. Hope it’s far less than a minute.