Google Facets - An Open Source Tool to Analyze & Visualize your data
The major challenge which a data scientists face today is to visualize or understand the data and spot the complexity within the given data set and which results in spending lot of time in plotting graphs, finding correlations and feature engineering. With the help of this Google Open sourced tool developers can easily find the insights from the data and understands the features in the dataset and how it is correlated and distributed and missing values and any other intelligence they want to draw before really starting the dataset analysis.
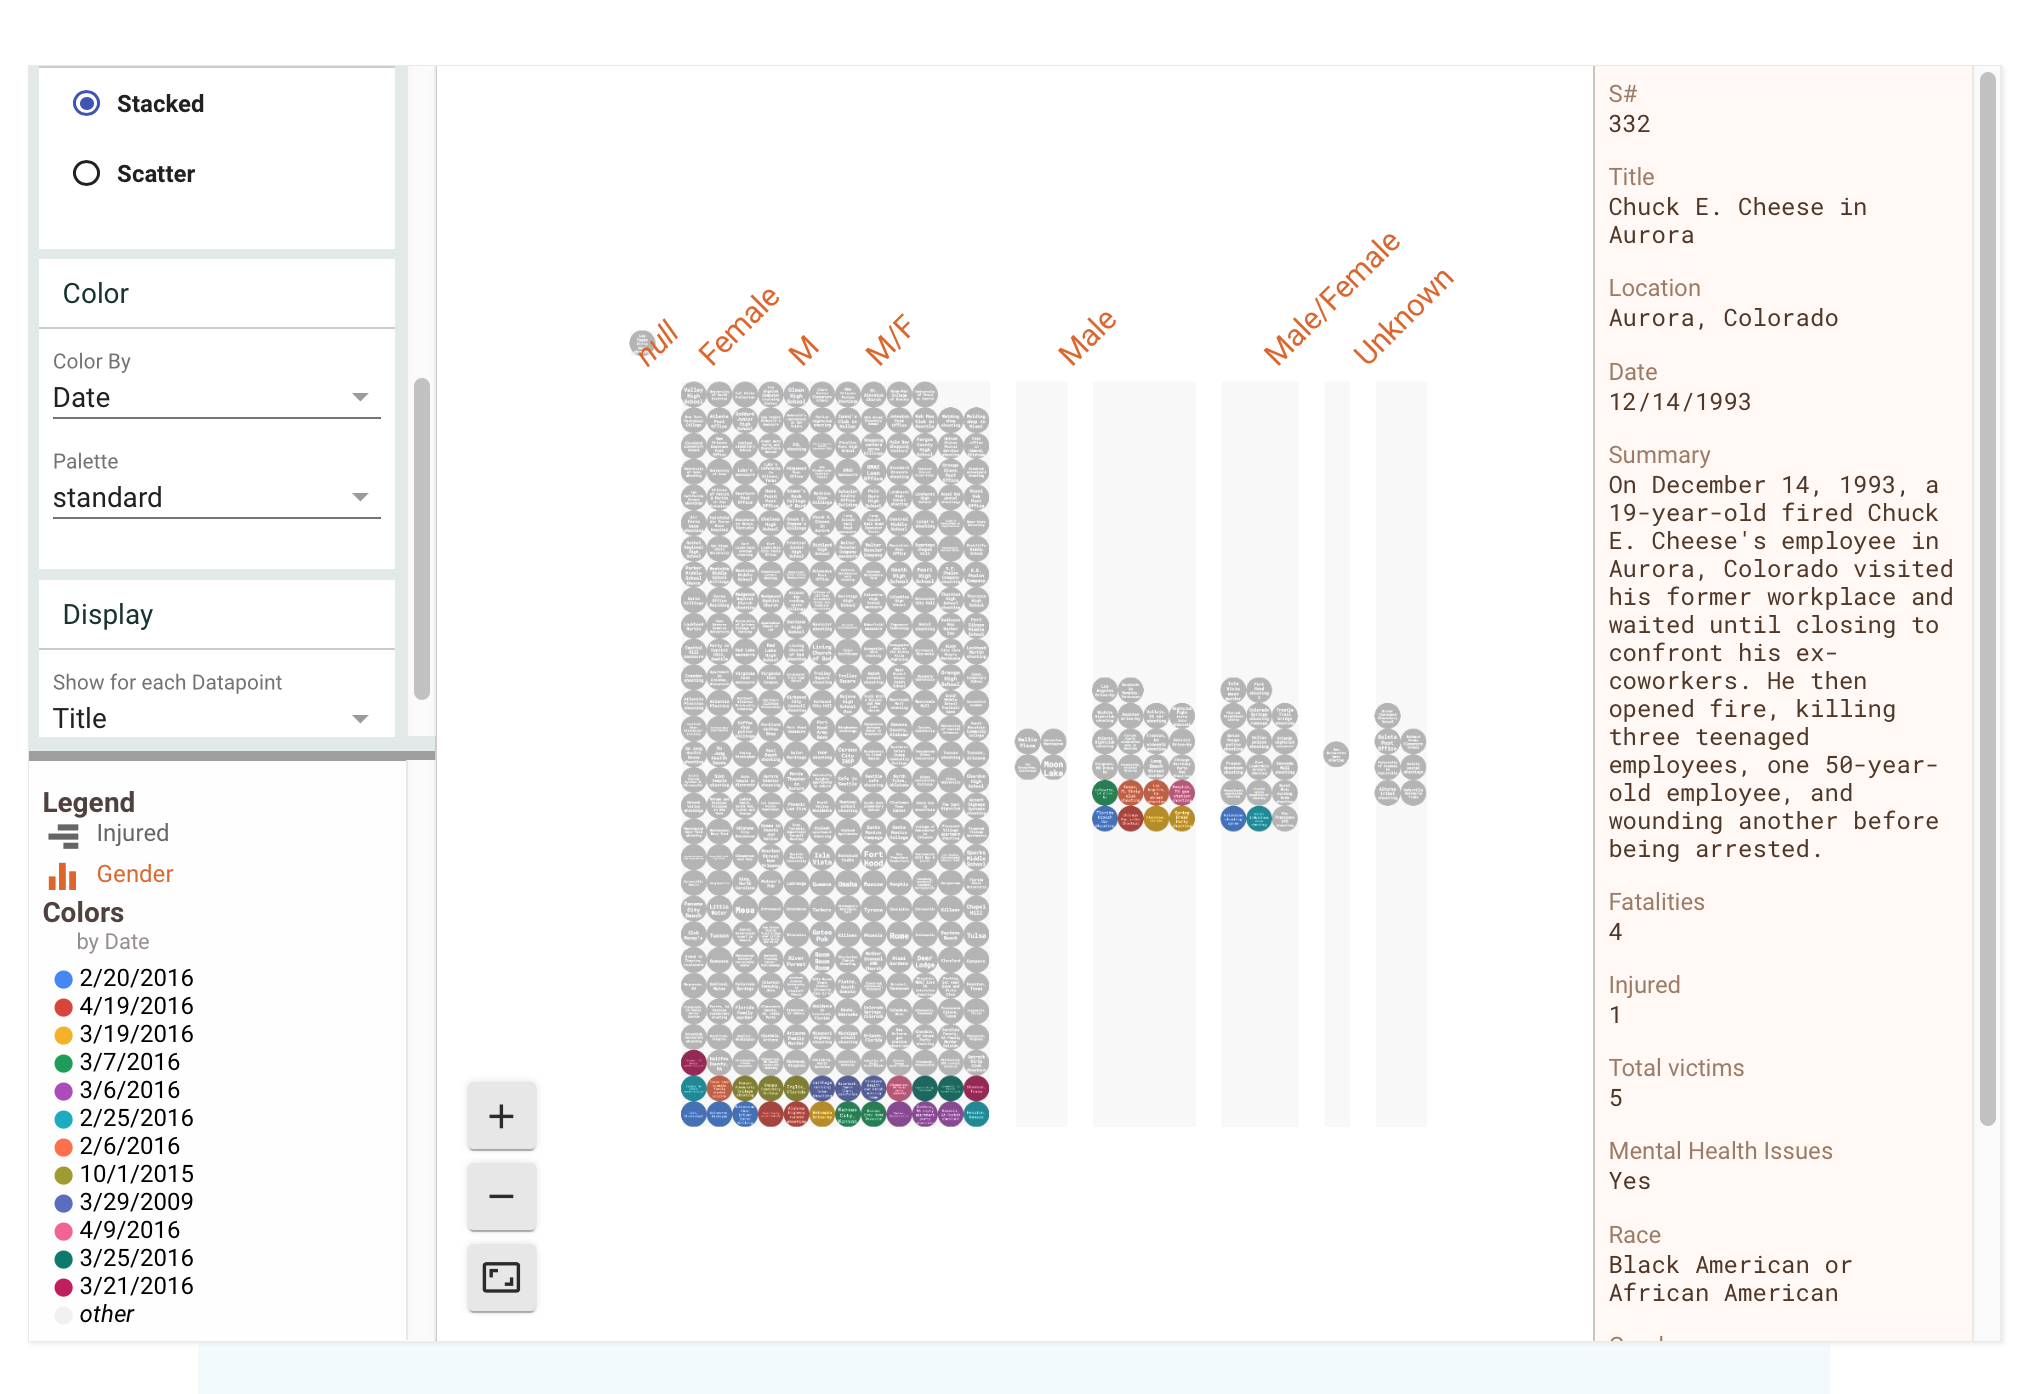
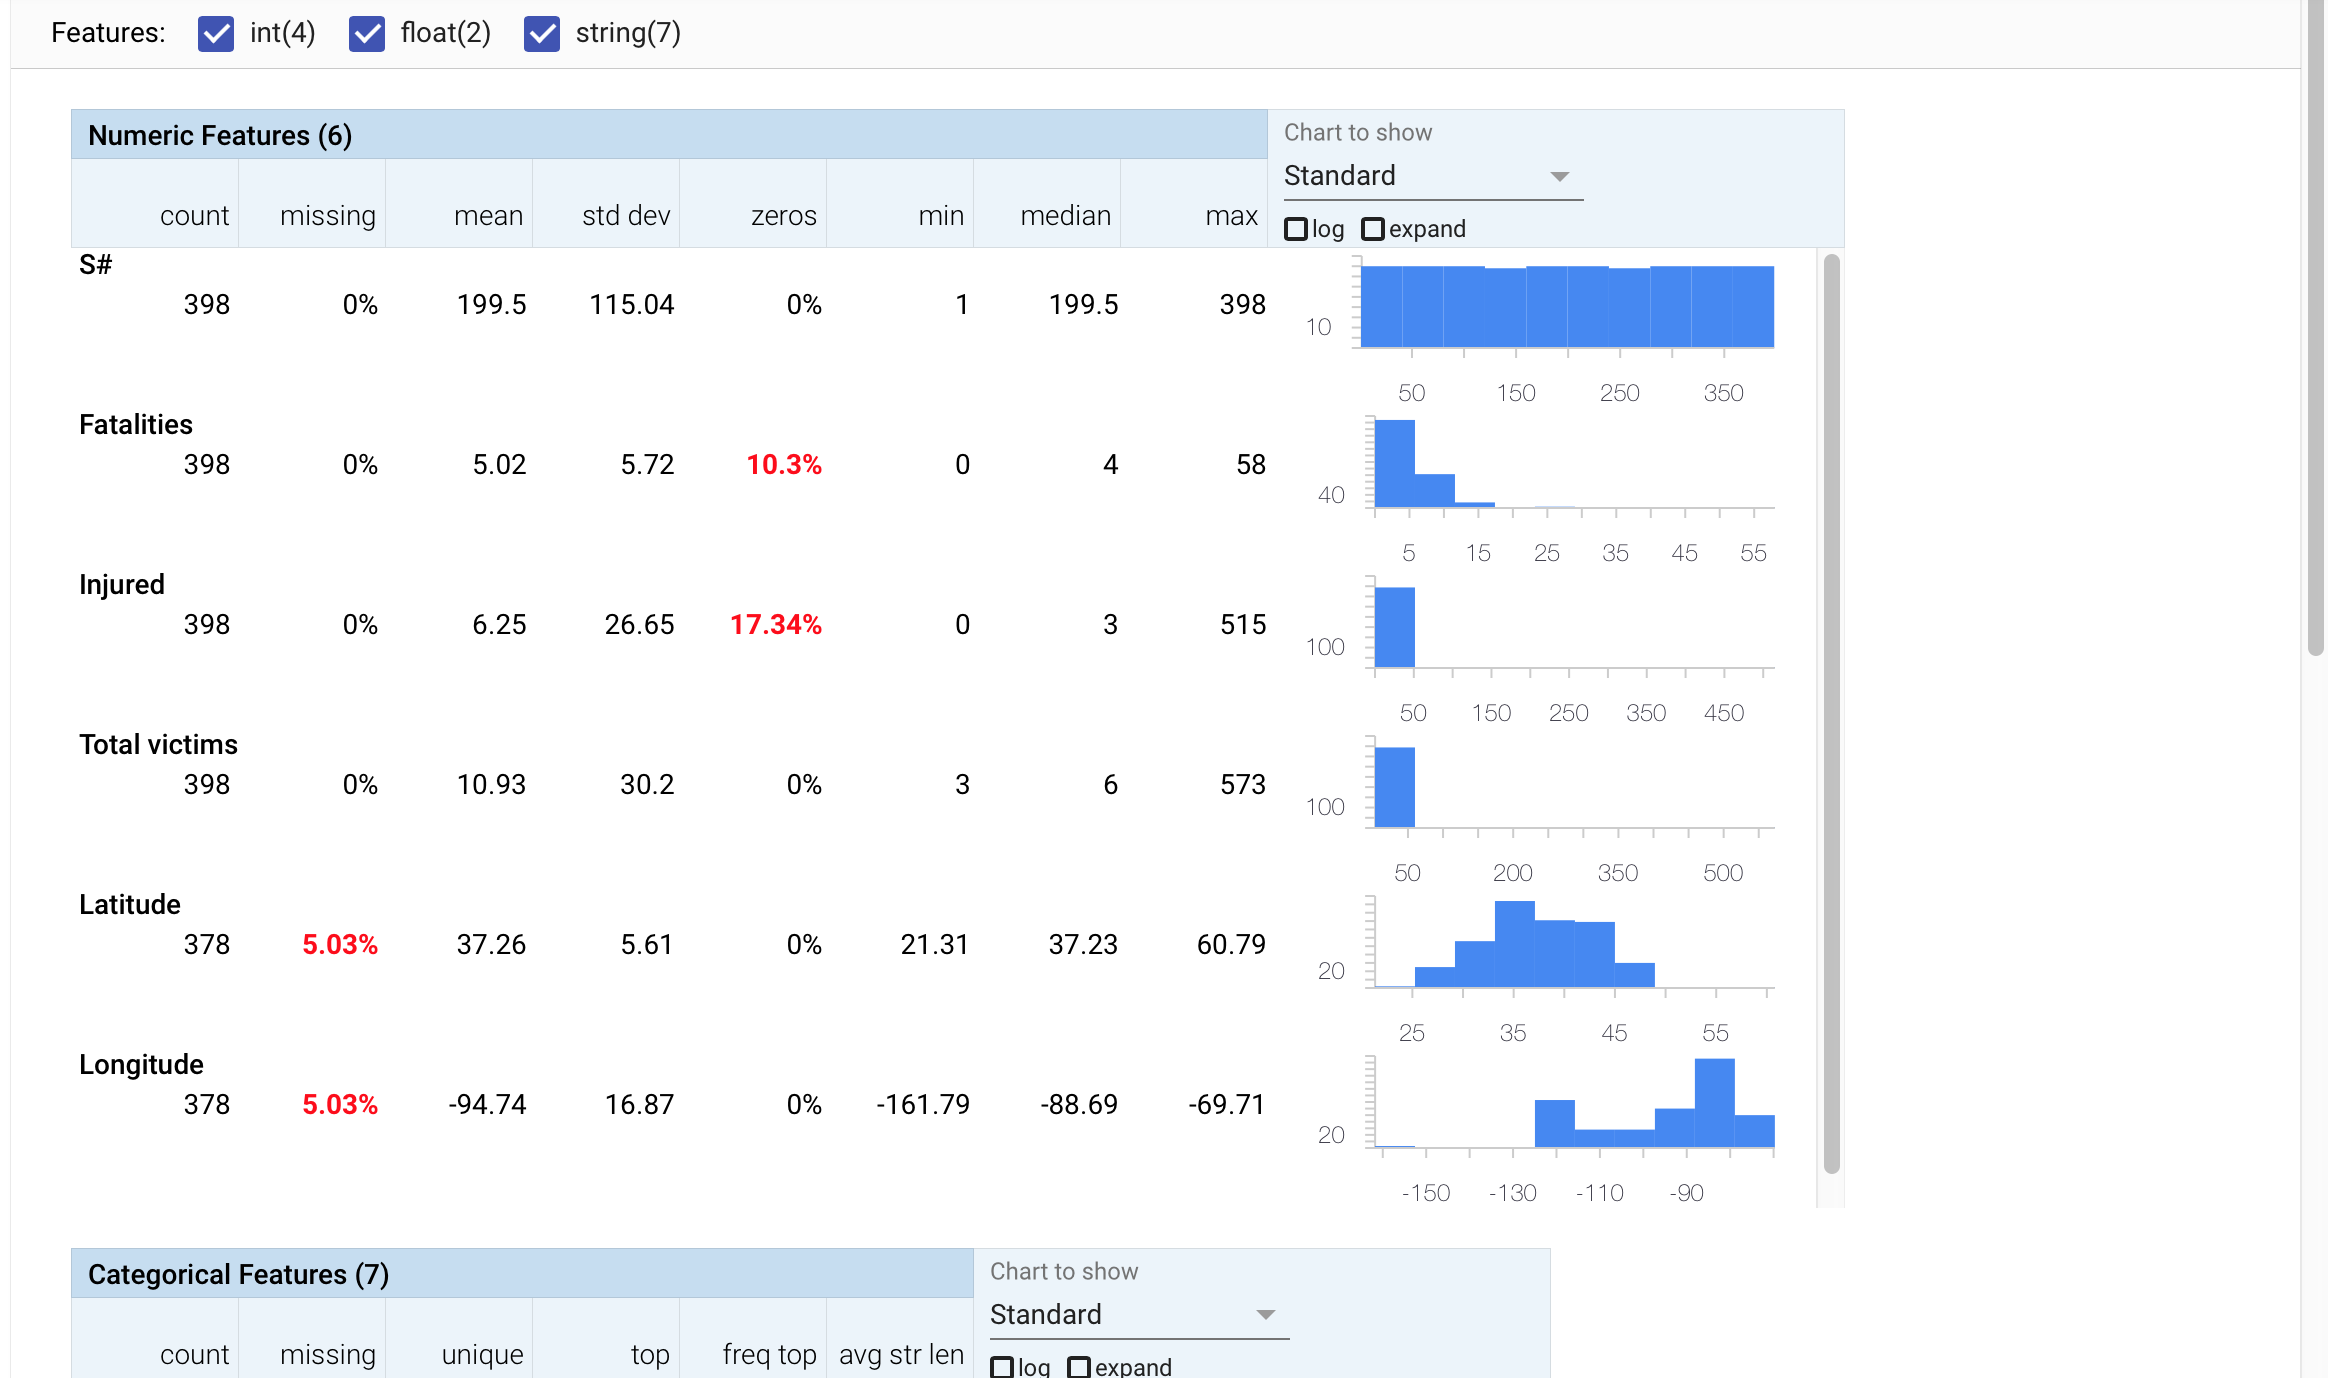
Facets has two visualization tools: Facets Overview and Facets Dive, Overview will be general enough to be used for summary statistics of any set of data. The feature statistics are different depending on the feature data type (numeric, string, or raw bytes) Whereas Dive provides an interactive interface for exploring the relationship between data points across all the of the different feature dataset.
Mass Shootings Dataset.csv
Source: https://www.kaggle.com/zusmani/us-mass-shootings-last-50-years/data
Useful Links:
Facet Website: https://pair-code.github.io/facets/
Facet Overview Github: https://github.com/PAIR-code/facets/tree/master/facets_overview