Pandas Exploratory Data Analysis: Data Profiling with one single command
We cannot see all the details through a large dataset and its important to go for a Exploratory data analysis. As a Data Scientist you would be always curious to know for a new data set what are the missing values in a column? How are the features co-related? What is the max, min or Outlier in the data? and sometimes we have to plot and Visualize this data and see the details.
A Data Scientist understand the importance of Feature Engineering and how a pre-step of EDA helps to understand the data and get the important insight and statistical measures from a dataset which is critical to define and refine our features that we will be using for Modelling, Training etc.
There are functions available in Pandas to get that insight like describe,info etc. but those are pretty basics and with the help of Data Visualization tools like matplotlib, seaborne and plotly we can plot the visualization as well.
But coming up with an EDA report has always been a tedious process and we all at one point of time have thought if we can automate this process and pandas_profiling exactly does the same thing. It generates the profile report for the dataframe.
As per their Documentation Following Statistics is generated for each of the column:
Essentials: type, unique values, missing values
Quantile statistics like minimum value, Q1, median, Q3, maximum, range, interquartile range
Descriptive statistics like mean, mode, standard deviation, sum, median absolute deviation, coefficient of variation, kurtosis, skewness
Most frequent values
Histogram
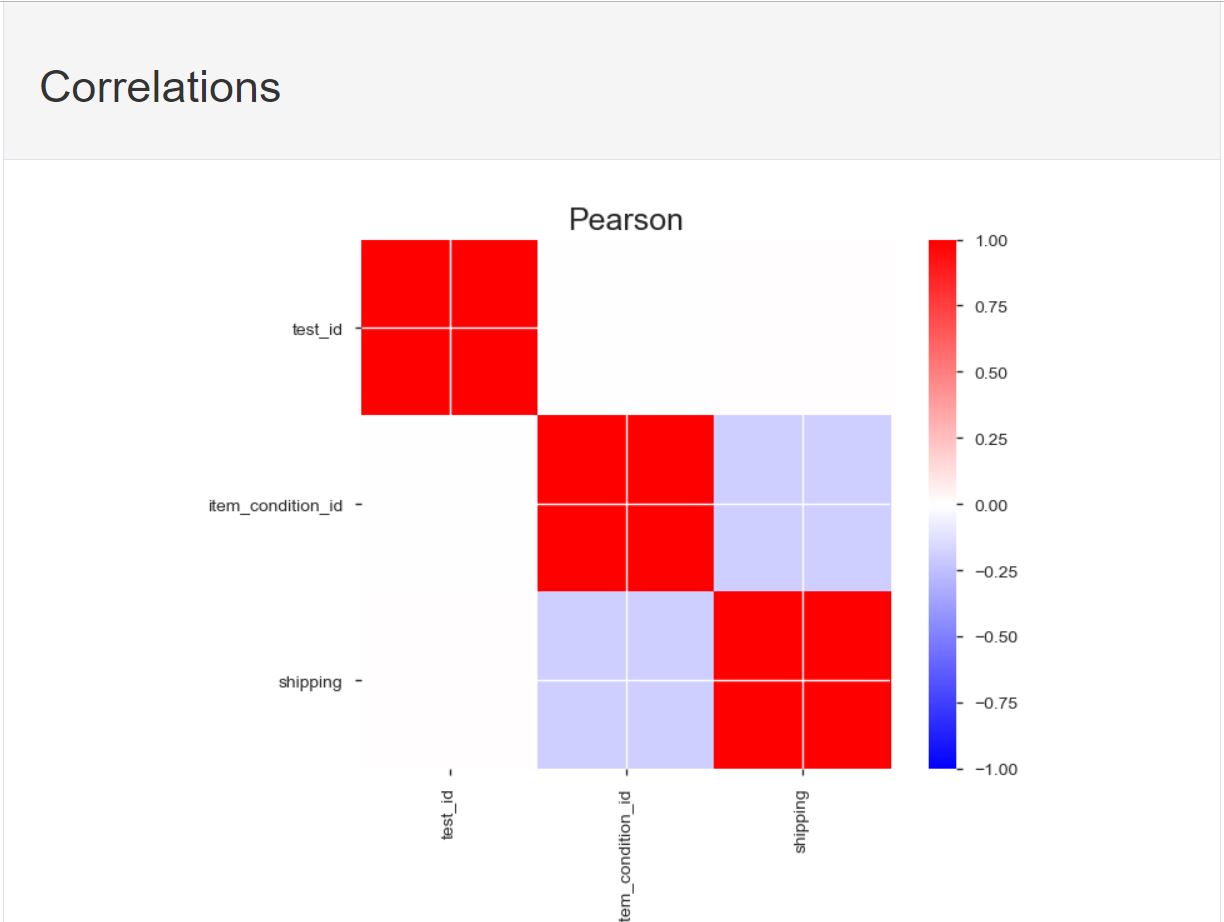
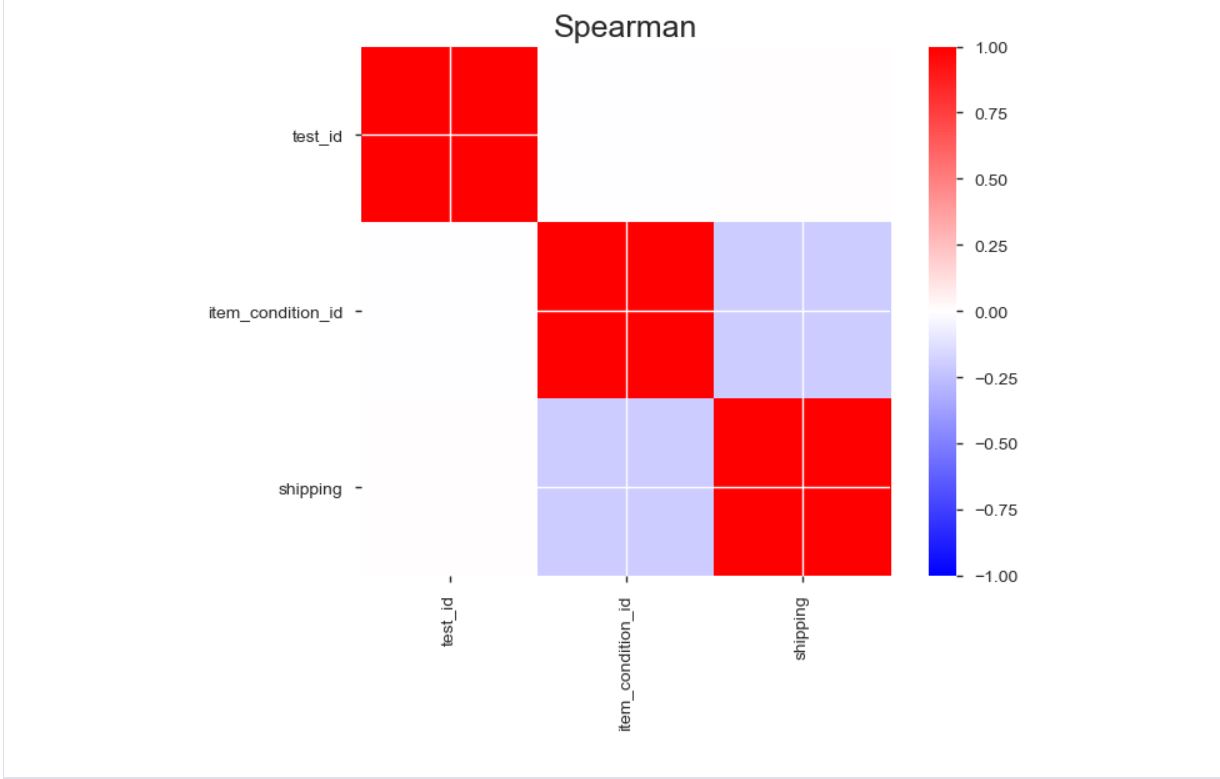
Correlations highlighting of highly correlated variables, Spearman and Pearson matrixes
Read Data in Pandas Dataframe:
import pandas_profiling
import pandas as pd
df=pd.read_csv("C:\\Personal\\MNISTDataset\\Mercari_Price\\test.tsv",sep='\t')
Run Profiler on the Dataframe:
pfrep=pandas_profiling.ProfileReport(df)
Print the report to HTML File:
You can either view the report in Jupyter notebook or print it in a HTML file
pfrep.to_file('./profile_report.html')
Report Contents:
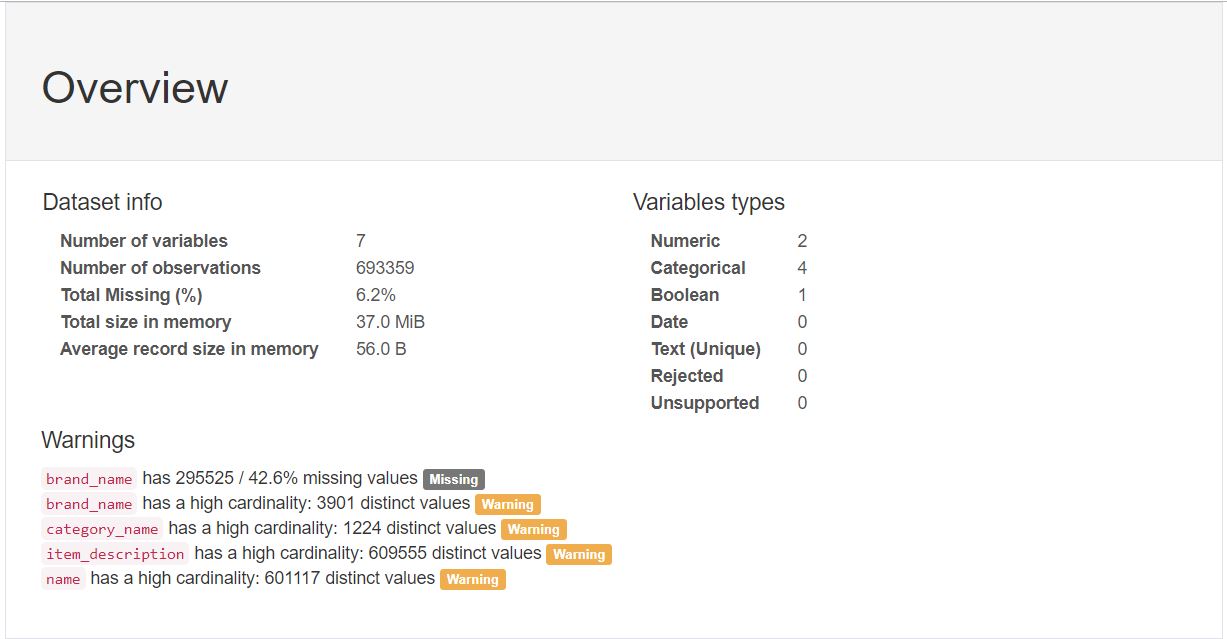
A complete Overview of the data like Number of Variables, Missing Percent, Size. How many Categorical, Numerical column types?
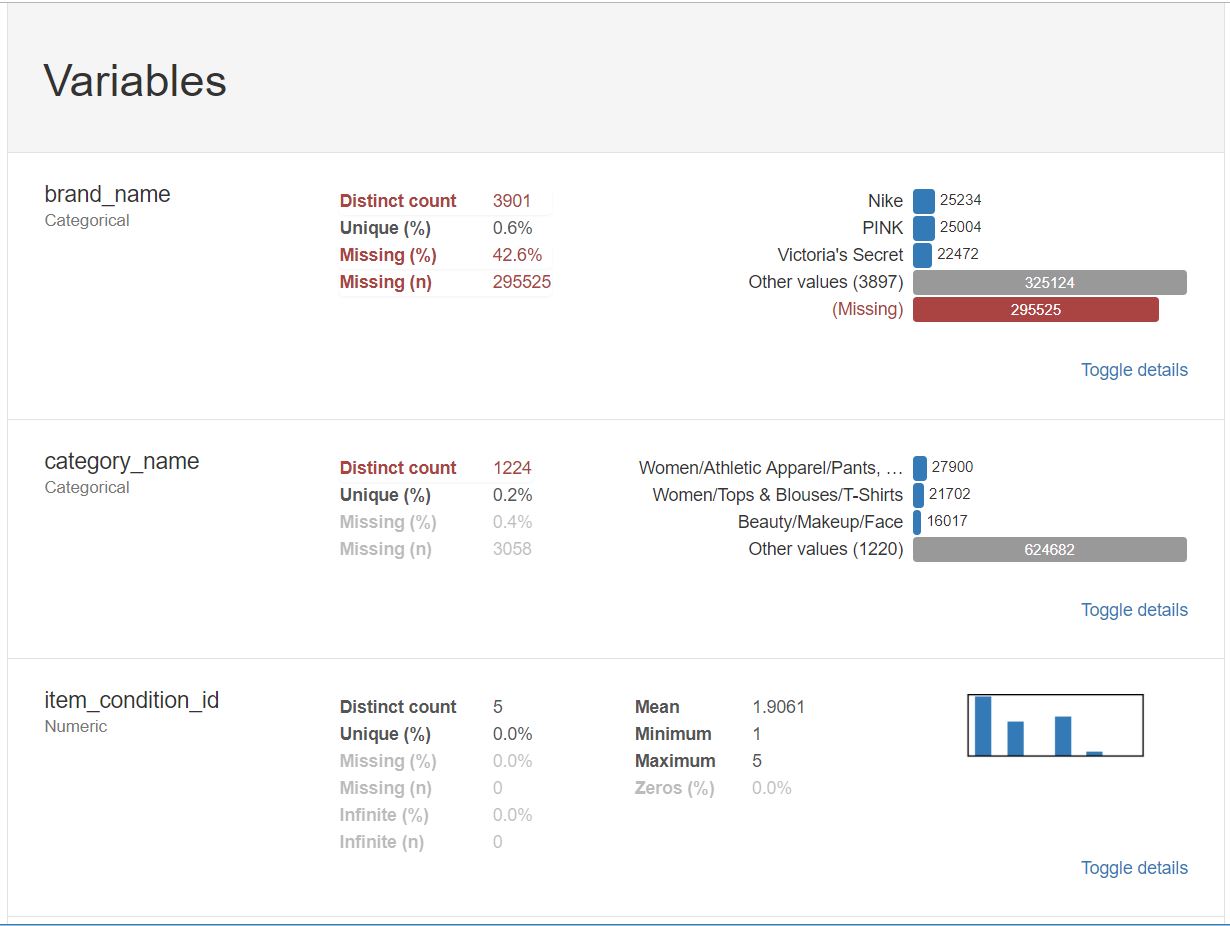
All the Feature Variables in the data and basic statistics like Missing values, Unique values etc. and also a small Horizontal Bar graph on the right to show top 5 values
Pearson and Spearmans Correlation coefficient between each of the Features
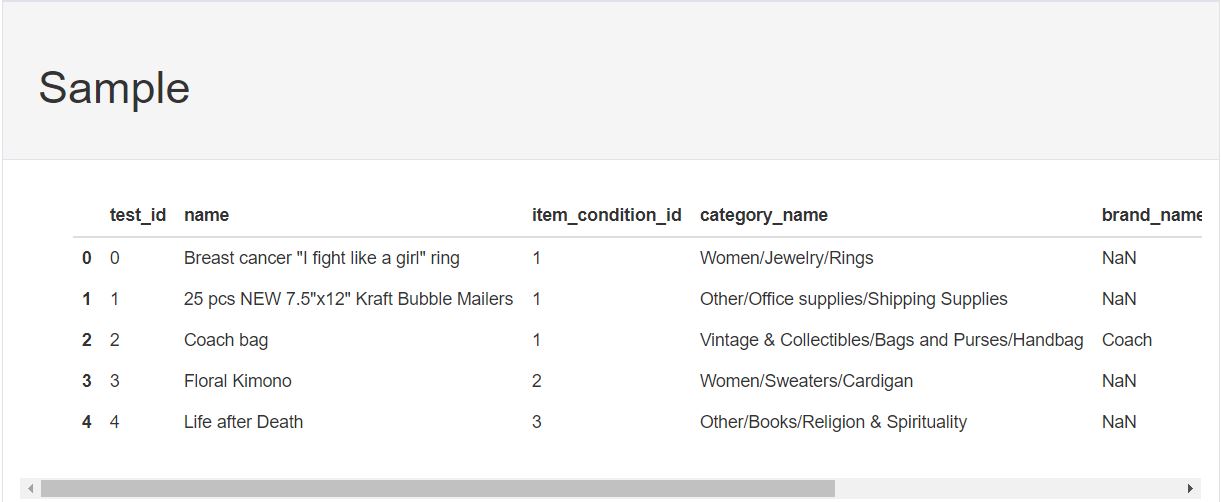
Sample of the Record which is same as df.head()