How to create Pandas Pivot Table
Pivot table lets you calculate, summarize and aggregate your data. MS Excel has this feature built-in and provides an elegant way to create the pivot table from data. its a powerful tool that allows you to aggregate the data with calculations such as Sum, Count, Average, Max, and Min. and also configure the rows and columns for the pivot table and apply any filters and sort orders to the data once pivot table has been created.Coming to Python, Pandas has a feature to build Pivot table and Crosstab using the Dataframe or list of Data. In this article we will see how to use Pivot feature and what are the various options available to build a meaningful Pivot and summarize your data using pandas.
Lets create a dataframe of different ecommerce site and their monthly sales in different Category
import pandas as pd
import numpy as np
df = pd.DataFrame({'site' : ['walmart', 'amazon', 'alibaba', 'flipkart','alibaba','flipkart','walmart', 'amazon', 'alibaba', 'flipkart'],
                   'Product_Category' : ['Kitchen', 'Home-Decor', 'Gardening', 'Health', 'Beauty', 'Garments',
                                         'Gardening', 'Health', 'Beauty', 'Garments'] ,
                   'Product' : ['Oven','Sofa-set','digging spade','fitness band','sunscreen','pyjamas','digging spade',
                               'fitness band','sunscreen','pyjamas'],
                   'Sales' : [2000,3000,4000,5000,6000,9000,3000,2500,1020,950]})
df
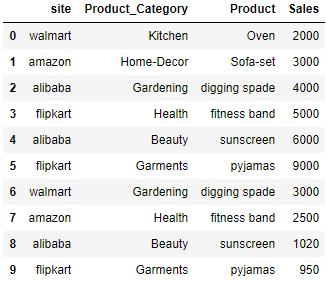
There are 4 sites and 6 different product category. We will now use this data to create the Pivot table. Before using the pandas pivot table feature we have to ensure the dataframe is created if your original data is stored in a csv or you are pulling it from the database. Read this post to find out how data can be imported and merged into a dataframe using pandas.
Create Pivot Table
df.pivot_table( index=['Product_Category', 'Product'], values=['Sales'], columns=['site'])
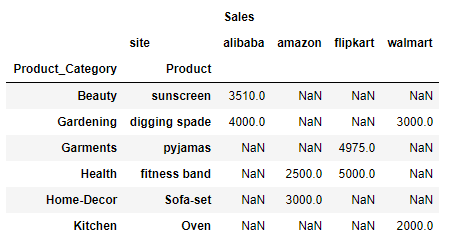
Important thing to note here is that attribute index is the list of rows in data and columns is the columns for the rows for which you want to see the Sales data i.e. values. So here we want to see the Product Category and Product and their sales data for each of the sites as column.
By default the aggreggate function is mean. So lets check how mean is calculated here:
Take the first row Product Category: Beauty and Product: sunscreen and for site alibaba there are two rows in the above dataframe i.e. index 4 and 8. Now calculate the average of the sales data in these two rows (6000+1020)/2 = 7020/2 = 3510
and that is the value under alibaba for the first row i.e. Beauty and sunscreen
Similarly for second row i.e. Product Category: Gardening and Product: digging spade there are two rows at index 2 and 6. However they both belong to unique site i.e. alibaba and walmart so their individual values are 4000 and 3000.
And for the third row Product Category: Garments and Product: pyjamas, there are two rows at index 5 and 9 and both belongs to site flipkart and their respective sales value are 9000 and 950 and average value will be 9950/2 = 4975 and that’s the value for third row under flipkart
Hope you understand how the aggregate function works and by default mean is calculated when creating a Pivot table
Pandas Pivot Table Aggfunc
Lets see another attribute aggfunc where you can add one or list of functions so we have seen if you dont mention this param explicitly then default func is mean. Now lets check another aggfunc i.e. sum,min,max,count etc.
Lets start with a single function min here
df.pivot_table( index=['Product_Category', 'Product'], values=['Sales'], columns=['site'], aggfunc=min)
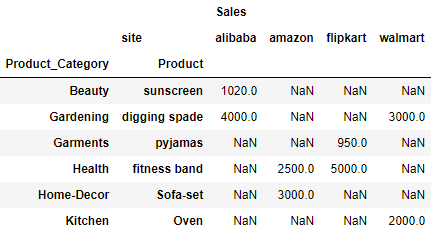
its trying to find a minimum value of the group. For example: first row i.e. Product_Category: Beauty and Product: sunscreen the minimum sales value between the two rows in the dataframe at index 4 and 8 is 1020
Similarly for row #3 the sales value for two rows Product_Category: Garments and Product: pyjamas in the dataframe is 9000 and 950 and the minimum value out of two is 950, which is the value for the row#3 under flipkart
List of Aggfunc
Lets add two aggfunc in a list i.e. min and sum
df.pivot_table( index=['Product_Category', 'Product'], values=['Sales'], columns=['site'], aggfunc=[min,sum])
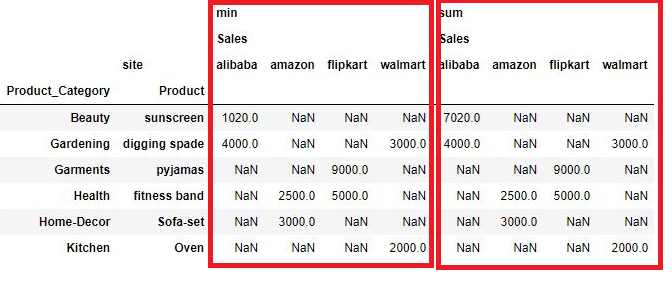
You can see here the two tables one is min and other is sum, enclosed in red box. Ive already explained the min table so lets understand how sum is calculated.
For row#1 Product_Category: Beauty and Product: sunscreen the two values in the above dataframe are 6000 and 1020 and their sum is 7020 which is the value under alibaba for the first row
Pivot Tables Margins
Now there is another useful param in the pivot table and that is known as margin which is used for summarizing the row and column values. if margin is set to True then a row and column All is added and the aggfunc i.e. min will be apllied on Margin column All also
df.pivot_table( index=['Product_Category', 'Product'], values=['Sales'], columns=['site'], aggfunc=[min], margins=True)
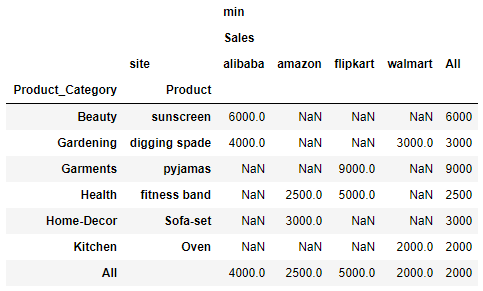
For example: Row#2 there are two values 4000 and 3000. therefore the All column contains 3000 which is the min value out of two. Similarly for column Sales - alibaba there are two values 6000 and 4000 and therefore the min value out of two 4000 is value in All column
Pivot Table Margins Name
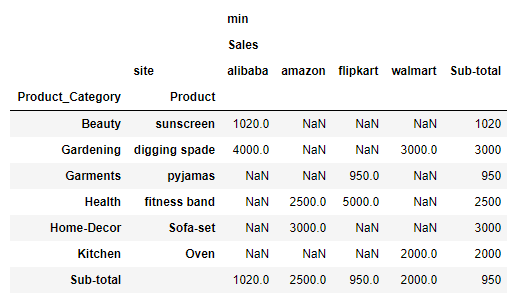
You can also rename the All column using another params which is margins_name. So here Ive replaced both the column names as Sub-total
df.pivot_table( index=['Product_Category', 'Product'], values=['Sales'], columns=['site'], aggfunc=[min]
              , margins=True, margins_name = 'Sub-total')
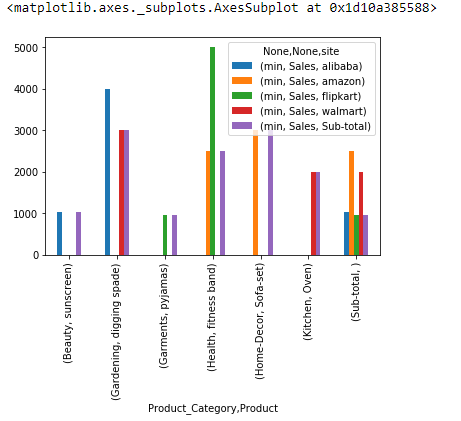
Plot Pivot Tables
%matplotlib inline
df.pivot_table( index=['Product_Category', 'Product'], values=['Sales'], columns=['site'], aggfunc=[min], margins=True, margins_name = 'Sub-total') .plot(kind='bar')
Export Pivot Table to Excel
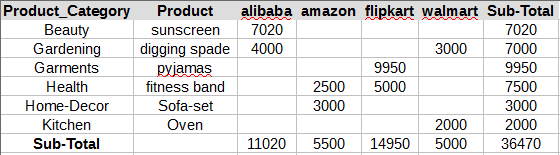
So you have a nice looking Pivot table and you want to export this to an excel. Use Pandas to_csv function to export the pivot table or crosstab to csv
pd.crosstab([df.Product_Category,df.Product],df.site,values=df.Sales,aggfunc=sum,margins=True,margins_name='Sub-Total')
.to_csv('./cross_tab_result.xls')
Conclusion:
So we have seen how Pivot features works with any data and can be used to quickly build the pivot table using the data. Only thing you have to keep in mind that crosstab works with series, list or dataframe columns but pivot table works with the entire dataframe.