How to use Pandas Count and Value_Counts
Counting number of Values in a Row or Columns is important to know the Frequency or Occurrence of your data.
In this post we will see how we to use Pandas Count() and Value_Counts() functions
Let’s create a dataframe first with three columns A,B and C and values randomly filled with any integer between 0 and 5 inclusive
import numpy as np
import pandas as pd

df = pd.DataFrame(np.random.randint(0, 5, (5, 3)), columns=["A", "B","C"])
df.replace(1,np.nan,inplace=True)
Pandas Count Number of Rows and Columns
First find out the shape of dataframe i.e. number of rows and columns in this dataframe
df.shape
(5, 3)
Here 5 is the number of rows and 3 is the number of columns
Pandas Count Values for each Column
We will use dataframe count() function to count the number of Non Null values in the dataframe.
We will select axis =0 to count the values in each Column
df.count(0)
A    5
B    4
C    3
dtype: int64
You can count the non NaN values in the above dataframe and match the values with this output
Pandas Count Values for each row
Change the axis = 1 in the count() function to count the values in each row. All None, NaN, NaT values will be ignored
df.count(1)
0    3
1    3
2    3
3    2
4    1
dtype: int64
Pandas Count Along a level in multi-index
Now we will see how Count() function works with Multi-Index dataframe and find the count for each level
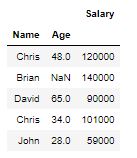
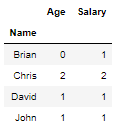
Let’s create a Multi-Index dataframe with Name and Age as Index and Column as Salary
idx = pd.MultiIndex.from_tuples([('Chris',48), ('Brian',np.nan), ('David',65),('Chris',34),('John',28)],
                                 names=['Name', 'Age'])
col = ['Salary']

df = pd.DataFrame([120000, 140000, 90000, 101000, 59000], idx, col)
df
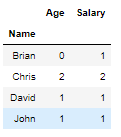
In this Multi-Index we will find the Count of Age and Salary for level Name
You can set the level parameter as column “Name” and it will show the count of each Name Age and Salary
Brian’s Age is missing in the above dataframe that’s the reason you see his Age as 0 i.e. No value available for his age but his Salary is present so Count is 1
df.count(level='Name')
Pandas Count Groupby
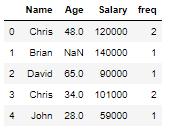
You can also do a group by on Name column and use count function to aggregate the data and find out the count of the Names in the above Multi-Index Dataframe function
Note: You have to first reset_index() to remove the multi-index in the above dataframe
df=df.reset_index()
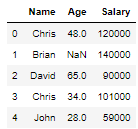
df.groupby(by='Name').agg('count')
Alternatively, we can also use the count() method of pandas groupby to compute count of group excluding missing values
df.groupby(by='Name').count()
if you want to write the frequency back to the original dataframe then use transform() method. You can learn more about transform here.
df['freq']=df.groupby(by='Name')['Name'].transform('count')
df
Pandas Count rows with Values
There is another function called value_counts() which returns a series containing count of unique values in a Series or Dataframe Columns
Let’s take the above case to find the unique Name counts in the dataframe
#value counts
# Remove the multi-index using reset_index() in the above dataframe
df=df.reset_index()
df['Name'].value_counts()
Chris    2
John     1
Brian    1
David    1
Name: Name, dtype: int64
Sort by Frequency
You can also sort the count using the sort parameter
#sort by frequency
df['Name'].value_counts(sort=True)
Chris    2
John     1
David    1
Brian    1
Name: Name, dtype: int64
Sort by Ascending Order
Sort the frequencies in Ascending order
# sort by ascending
df['Name'].value_counts(sort=True, ascending=True)
David    1
Brian    1
John     1
Chris    2
Name: Name, dtype: int64
Value Counts Percentage or Relative Count
You can also get the relative frequency or percentage of each unique values using normalize parameters
# Relative counts - find percentage
df['Name'].value_counts(normalize=True)
Chris    0.4
John     0.2
Brian    0.2
David    0.2
Name: Name, dtype: float64
Now Chris is 40% of all the values and rest of the Names are 20% each
Binning
Rather than counting you can also put these values into bins using the bins parameter
This works only for Numeric data
df['Salary'].value_counts(bins=2)
(99500.0, 140000.0]     3
(58918.999, 99500.0]    2
Name: Salary, dtype: int64
Pandas Value Count for Multiple Columns
value_counts() method can be applied only to series but what if you want to get the unique value count for multiple columns?
No need to worry, You can use apply() to get the count for each of the column using value_counts()
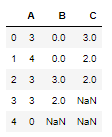
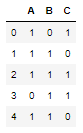
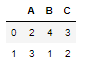
Let’s create a new dataframe
df = pd.DataFrame(np.random.randint(0, 2, (5, 3)), columns=["A", "B","C"])
df
Apply pd.Series.value_counts to all the columns of the dataframe, it will give you the count of unique values for each row
df.apply(pd.Series.value_counts, axis=1)
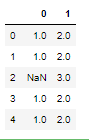
Now change the axis to 0 and see what result you get, It gives you the count of unique values for each column
df.apply(pd.Series.value_counts, axis=0)
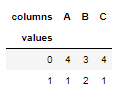
Alternatively, you can also use melt() to Unpivot a DataFrame from wide to long format and crosstab() to count the values for each column
df1 = df.melt(var_name='columns', value_name='values')
pd.crosstab(index=df1['values'], columns=df1['columns'])
Pandas Count Specific Values in Column
You can also get the count of a specific value in dataframe by boolean indexing and sum the corresponding rows
If you see clearly it matches the last row of the above result i.e. count of value 1 in each column
df[df == 1].sum(axis=0)
A    3.0
B    1.0
C    2.0
dtype: float64
Pandas Count Specific Values in rows
Now change the axis to 1 to get the count of columns with value 1 in a row
You can see the first row has only 2 columns with value 1 and similarly count for 1 follows for other rows
#By row
df[df == 1].sum(axis=1)
0    2.0
1    2.0
2    3.0
3    2.0
4    2.0
dtype: float64
Conclusion
Finally we have reached to the end of this post and just to summarize what we have learnt in the following lines:
- Pandas count value for each row and columns using the dataframe count() function
- Count for each level in a multi-index dataframe
- Pandas
value_counts()method to find frequency of unique values in a series - How to apply
value_countson multiple columns - Count a Specific value in a dataframe rows and columns
if you know any other methods which can be used for computing frequency or counting values in Dataframe then please share that in the comments section below