How to normalize data in pandas crosstab
Pandas Crosstabs
Its a tabular structure showing relationship between different variables.
The Pandas crosstab and pivot has not much difference it works almost the same way. The only difference that I see after going through the source code is Crosstab works with Series or list of Variables whereas Pivot works with dataframe and internally crosstab calls pivot table function.
When you have list of data or a Series then you should use crosstab and if its a dataframe then you should go for pivot table.
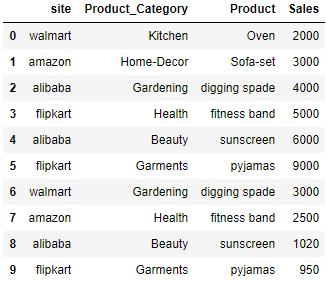
Lets create a dataframe of different ecommerce site and their monthly sales in different Category
import pandas as pd
import numpy as np
df = pd.DataFrame({'site' : ['walmart', 'amazon', 'alibaba', 'flipkart','alibaba','flipkart','walmart', 'amazon', 'alibaba', 'flipkart'],
                   'Product_Category' : ['Kitchen', 'Home-Decor', 'Gardening', 'Health', 'Beauty', 'Garments',
                                         'Gardening', 'Health', 'Beauty', 'Garments'] ,
                   'Product' : ['Oven','Sofa-set','digging spade','fitness band','sunscreen','pyjamas','digging spade',
                               'fitness band','sunscreen','pyjamas'],
                   'Sales' : [2000,3000,4000,5000,6000,9000,3000,2500,1020,950]})
df
Lets apply the crosstab on above dataframe. Here the default aggrfunc is count which means it finds the frequency of each of the row and respective column
pd.crosstab([df.Product_Category,df.Product],df.site)
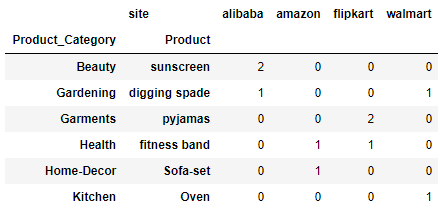
Row#1 Product Category: Beauty and Product: sunscreen and for site alibaba there are two rows in the above dataframe i.e. index 4 and 8 so the count is 2.
Similarly for row#3 Product Category: Garments and Product: pyjamas there are two rows in the dataframe and hence the count is 2 under flipkart
Crosstab Rownames and Column Names
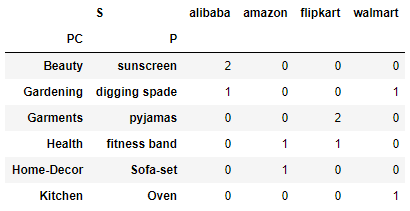
Lets change the row and column names using these two attibutes rownames and colnames. Let the Product_Category as PC, Product as P and Sales as S
pd.crosstab([df.Product_Category,df.Product],df.site,rownames=['PC','P'],colnames=['S'])
Crosstab Aggfunc
We will add another aggfunc sum and the column which we want to sum is Sales..
if you check the pivot table aggfunc sum output then it will be same as the output for crosstab
pd.crosstab([df.Product_Category,df.Product],df.site,values=df.Sales,aggfunc=sum,rownames=['PC','P'],colnames=['S'])
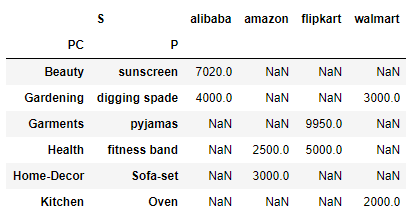
Please note when using aggfunc then parameter values is a required field
List of Aggfunc
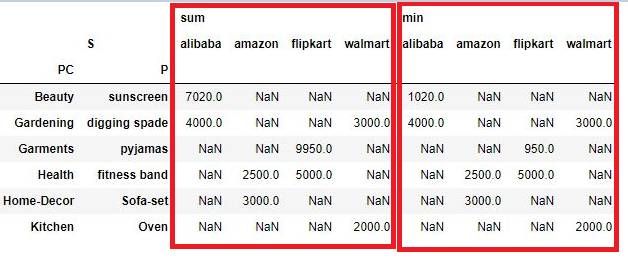
Lets take list of aggfunc i.e. sum, min, All these functions are stored in list and passed in aggfunc
pd.crosstab([df.Product_Category,df.Product],df.site,values=df.Sales,aggfunc=[sum,min],rownames=['PC','P'],colnames=['S'])
Crosstab Normalize - Find Percentage along Rows, Columns
The normalize function in crosstab is quite useful when you have to find the percentage or normalize the data across the rows and columns
The Normalize option in crosstab is not available in pivot table. It is a very useful option if you want to find the percentage or normalize the data by dividing all values by the sum of values in either row/column or all.
Lets take an example to understand this:
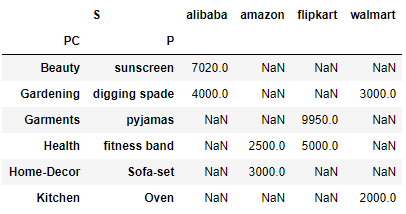
Here is the pivot value before Normalization
pd.crosstab([df.Product_Category,df.Product],df.site,values=df.Sales,aggfunc=sum,rownames=['PC','P'],colnames=['S'],)
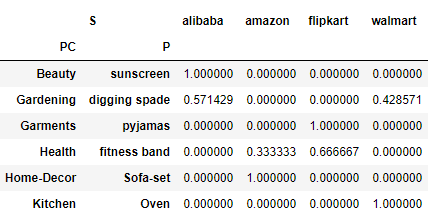
Now you want to see what is the percentage of each value in the column then you add the parameter normalize and pass columns string as shown below.
pd.crosstab([df.Product_Category,df.Product],df.site,values=df.Sales,aggfunc=sum,rownames=['PC','P'],colnames=['S'],
           normalize='columns')
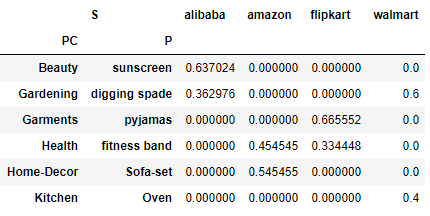
In the above dataframe if you add the column values and divide by each of the value then you will get the percentage or normalize value of each value. For example: column alibaba has two values 7020 and 4000, their sum would be 11020
Now divide 7020 and 4000 by 11020 and that would be 0.637 and 0.362 and and you can see these values in the column alibaba
Lets normalize over each of the row or find percentage across each row this time. Change the normalize value to index
pd.crosstab([df.Product_Category,df.Product],df.site,values=df.Sales,aggfunc=sum,rownames=['PC','P'],colnames=['S'],
           normalize='index')
Crosstab Margins and Margins Name
crosstab do have margins and margin_names as parameters to calculate the values across the rows and columns, it works the same way as in pivot table. Lets see:
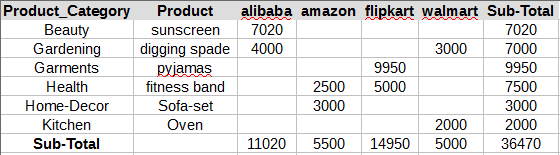
pd.crosstab([df.Product_Category,df.Product],df.site,values=df.Sales,aggfunc=sum,margins=True,margins_name='Sub-Total')
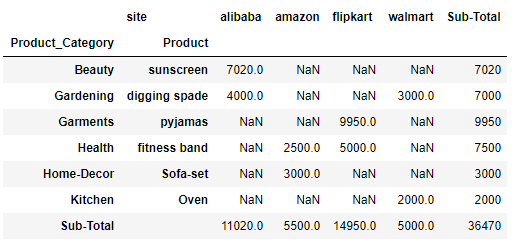
So the Sub-Total column contains the sum of rows and Sub-Total rows contains the sum of each columns.
please take a note that Sub-Total will perform the aggfunc defined on the rows and columns. here the aggrfunc is sum so it’s adding all the values . In case the value would had been mean or min/max then it would have done accordingly.
Imp Note: As of writing this post normalize and margins doesn’t work together on multiindex dataframe and this is a bug reported by me. Check this issue link
Export Crosstab to Excel
So you have a nice looking Pivot table and you want to export this to an excel. Use Pandas to_csv function to export the pivot table or crosstab to csv
pd.crosstab([df.Product_Category,df.Product],df.site,values=df.Sales,aggfunc=sum,margins=True,margins_name='Sub-Total')
.to_csv('./cross_tab_result.xls')