Python Plotting latitude and longitude from csv on map using basemap, folium, geopandas and plotly
In this article, we will see how to plot latititude, longitude from csv using Python. Here are the most popular python libraries to plot geo data on a map.
- Basemap
- Folium
- GeoPandas
- Plotly
Basemap
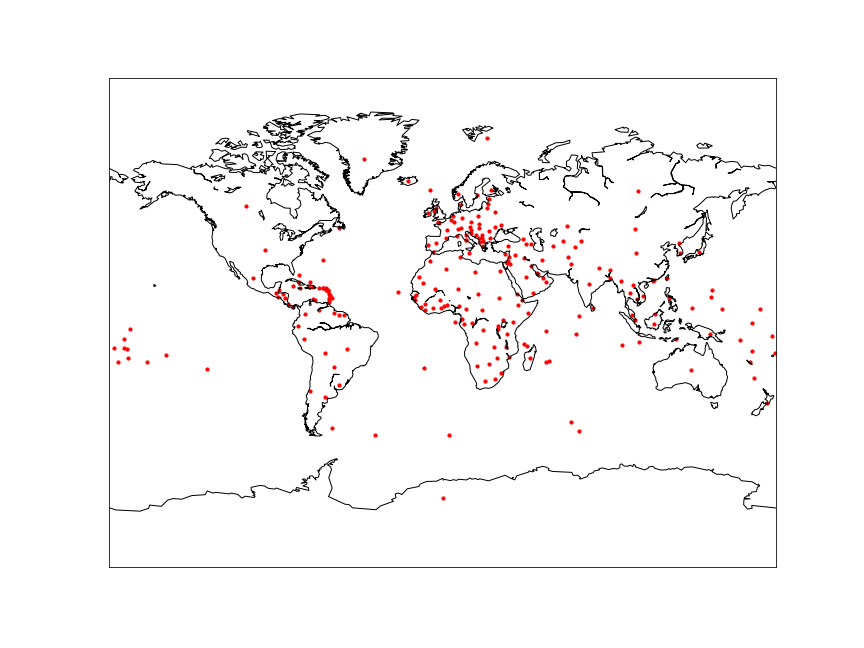
The basemap toolkit which can be found under mpl_toolkits is matplotlib’s main visualization tool. Matplotlib uses basemap to plot data on map projections. It has a wide range of capabilities, including the ability to plot points, lines, polygons, and shapes. The library is highly customizable and can be used to create geographical heat maps, plot weather data, and visualize spatio-temporal data.
Step 1
Import required libraries
# importing the libraries
%matplotlib inline
import pandas as pd
from mpl_toolkits.basemap import Basemap
import matplotlib.pyplot as plt
Step 2
Load csv with latitude, longitude
# setting the filepath and loading csv
countries = '/kaggle/input/countries/countries.csv'
data = pd.read_csv(countries)
Step 3
Setting map’s size and projecting the points on map
# setting the size of the map
fig = plt.figure(figsize=(12,9))


# creating the map - setting latitude and longitude
m = Basemap(projection = 'mill', llcrnrlat = -90, urcrnrlat = 90, llcrnrlon = -180, urcrnrlon = 180, resolution = 'c')
Step 4
Draw map’s coastline, state and countries border plotting the data
# drawing the coastline
m.drawcoastlines()
m.drawcountries(color='gray')
m.drawstates(color='gray')

# creating variable for latitude and longitude to list
lat = data['latitude'].tolist()
lon = data['longitude'].tolist()

# plotting the map
m.scatter(lon, lat, latlon = True, s = 10, c = 'red', marker = 'o', alpha = 1)

plt.show()
Note: x = longitude, y = latitude
Folium
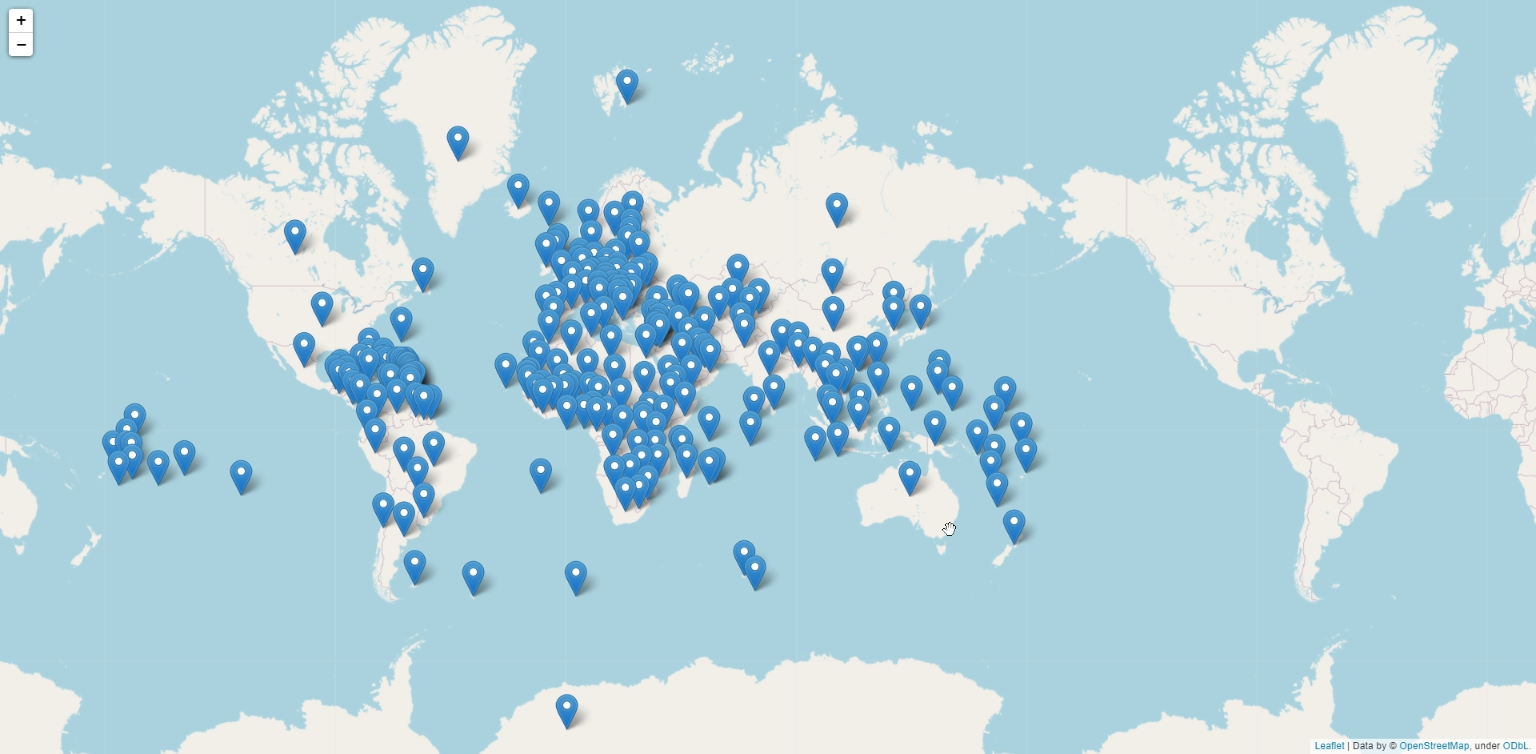
Folium creates interactive maps from data sources such as GeoJSON and Pandas dataframes. It is an excellent tool for plotting latitude and longitude locations and visualizing data on maps. To plot our data, we will use the folium.Map() function.
Step 1
Import required libraries
# importing the libraries
import pandas as pd
import folium
Step 2
Load csv with latitude, longitude
# setting the filepath and loading csv
countries = '/kaggle/input/countries/countries.csv'
data = pd.read_csv(countries)

# replacing missing values using fillna
data['latitude'] = data['latitude'].fillna(0)
data['longitude'] = data['longitude'].fillna(0)
Step 3
Setting map’s size and projecting the points on map using folium.Map()
#setting center for our map
center = [20.593684,78.96288]

# creating map
map = folium.Map(location = center, zoom_start = 2)
Step 4
We can add a single marker to our map by calling upon folium.Marker and passing in the location of the point, We need to plot all the points in the map so we will iterate through our data.
To make it appear on the map, we need to apply the .add_to() function and pass in our map object.
# loop to fetch data from dataframe
for i, j in data.iterrows():
    location = [j['latitude'], j['longitude']]
    folium.Marker(location, popup = f'Country:{j["name"]}').add_to(map)
Step 5
Display the points on the map by calling the map object m
# displaying the map
map
GeoPandas, Shapely
GeoPandas and Shapely is a powerful tool for creating geographic data visualizations. GeoPandas is a library that adds support for geographic data analysis to the popular Pandas library. Shapely is a library that provides access to geometric objects and operations.
The first step in plotting latitude and longitude with GeoPandas and Shapely is to create a geopandas dataframe. This is achieved by GeoDataFrame, a module of GeoPandas library. This creates a new column called geometry which saves the latitude and longitude in POINT, POLYGON or MULTIPOLYGON format. After creating the geodataframe, the points are plotted on a map.
Step 1
Import the required libraries
# importing the libraries
import pandas as pd
import geopandas as gpd
from geopandas import GeoDataFrame
from shapely.geometry import Point
Step 2
Load csv with latitude, longitude
# setting the filepath and loading csv
countries = '/kaggle/input/countries/countries.csv'
data = pd.read_csv(countries)
Step 3
Converting pandas dataframe to GeoPandas dataframe
# coverting csv to geopandas dataframe
geometry = [Point(xy) for xy in zip(data['longitude'], data['latitude'])]
gdf = GeoDataFrame(data, geometry = geometry)
Step 4
Plot the data on map
# plotting naturalearth_lowres map
world = gpd.read_file(gpd.datasets.get_path('naturalearth_lowres'))
gdf.plot(ax = world.plot(figsize = (10, 10)), color = 'red', markersize = 10)
Note: x = longitude, y = latitude

Plotly
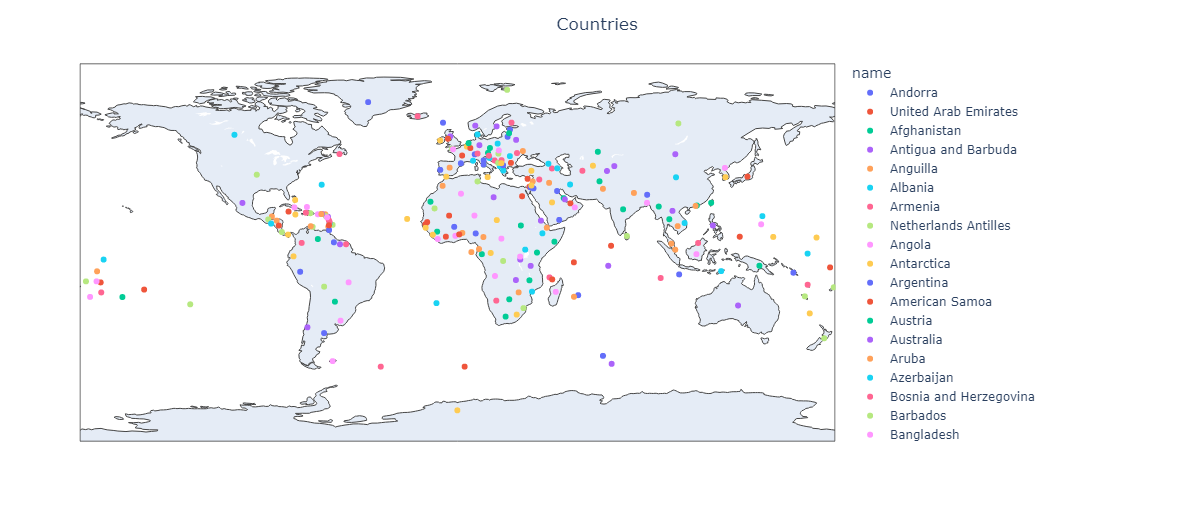
Plotly is the most powerful tool for data visualization in Python. It provides a wide range of dynamic and interactive charts and maps. Using plotly to plot latitude and longitude is a great way to quickly and easily visualize geographic data. We will use scatter_geo() function from plotly.express to create our map.
Step 1
importing required libraries
# importing the libraries
import plotly.express as px
import pandas as pd
Step 2
loading csv
# setting the filepath and loading csv
countries = '/kaggle/input/countries/countries.csv'
data = pd.read_csv(countries)
Step 3
plotting data with scatter_geo()
# plotting map using plotly
fig = px.scatter_geo(data, lat = 'latitude', lon = 'longitude', color = 'name')

# setting title for the map
fig.update_layout(title = 'Countries', title_x = 0.5)
Step 4
Display the map
# displaying the map
fig.show()
These are all basic maps features we can use to plot the latitude, longitude. However there’s a lot these libraries can do, Visit their official documentation page to know more about it.