Google Takeout: How to download your personal google data
I always wondered how our life would have been if Google hadn’t been there. We depend on most of things from our personal to professional life on Google and it’s app. Not even a single day goes by without accessing any of these Google apps. Our life is partially dependent on Google. My Mom always use to say there are two world which exists One where they were born and raised a pre-google era and One where we are born in a post-google era. It has made our life easier, flexible and easy to some extent. On the contrary I agree with many people that there can be a life without Google as well. There are billions of such peoples.
Google has no Inception in their Lives: Happy People!!
Source: Google Images - Kumbh Mela

Jokes Apart, Google has always been criticized & blamed for collecting all our data and even I have written an article earlier this month blaming google to read my credit card details without my consent. The usage and intervention of Google apps are so high in our life that we don’t even think for a second before sharing our Personal and sensitive data with Google. However Do you know that all our data is stored on Google Cloud and each one of us who has ever accessed any of the Google apps can view and download their data.
Many of us including me are always interested to see our historical data and analyze our expenses or our Geo data to see which all places we have visited with our friends, Family and excites looking at our old photos and remembering the memories of our Vacations and trips. Sometimes its feel good to be nostalgic.
Takeout your data:
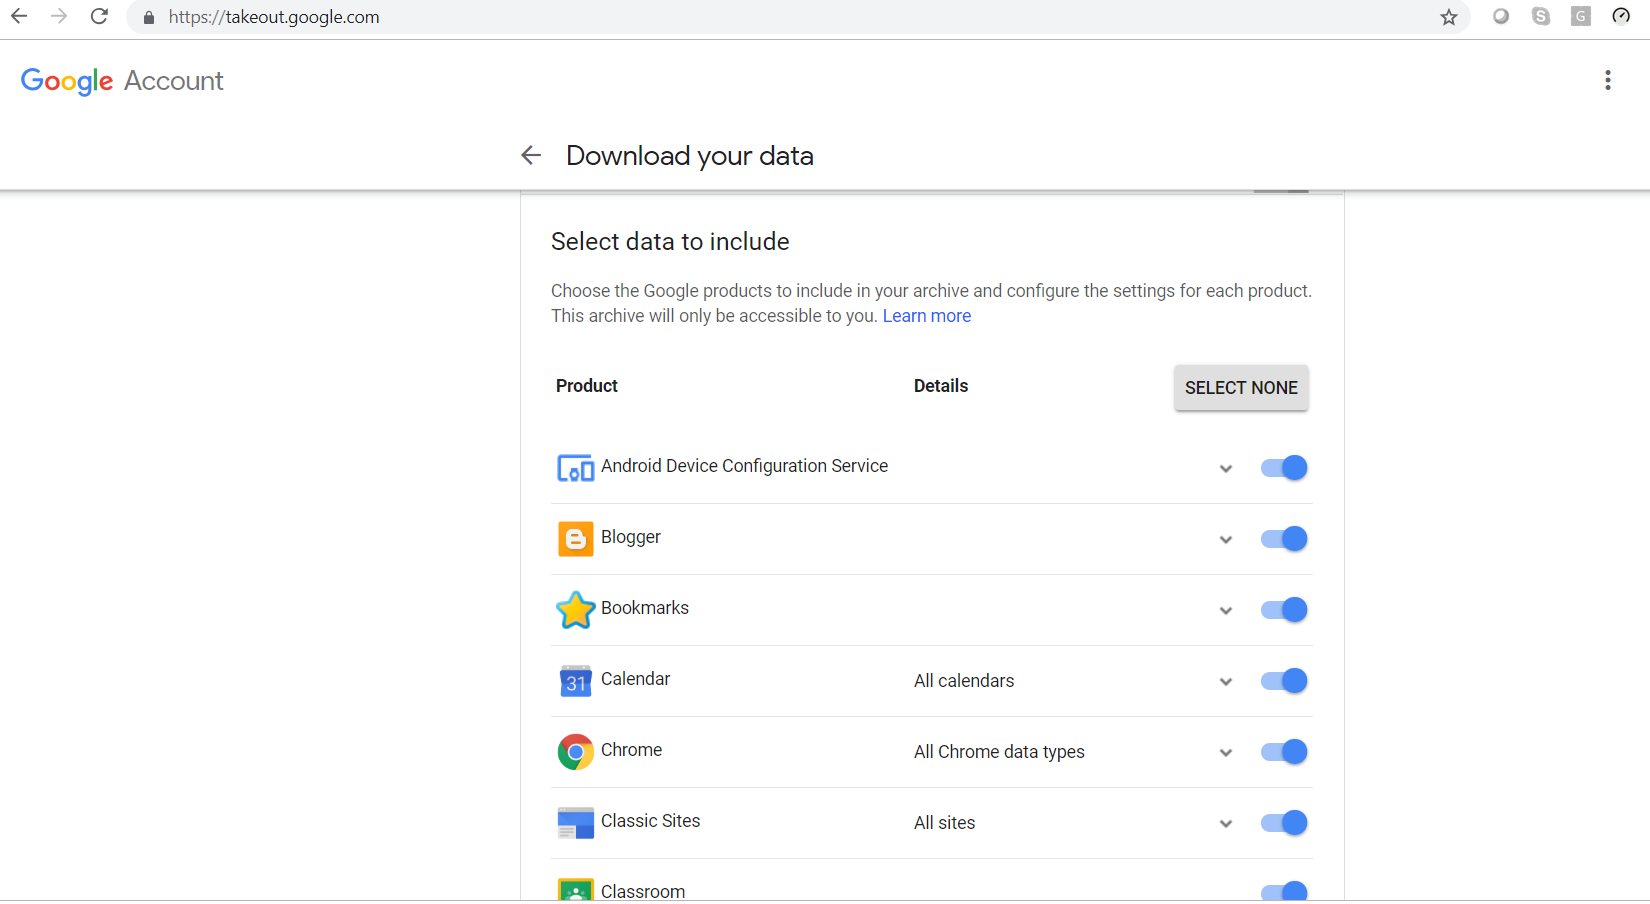
You can see all the varied list of products that you have ever accessed. Just select the ones which you are interested to see your data for.
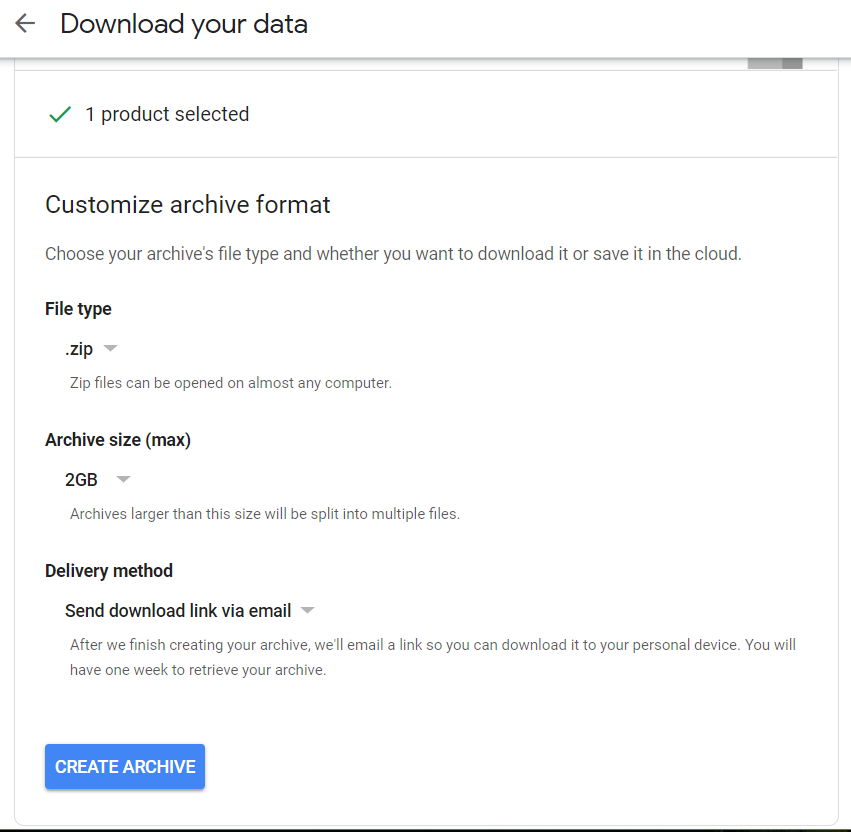
I have downloaded my maps and Google Pay data. Since I would like to see my trips year around and what are the places that I have visited frequently.
Also I was interested to see the expenses that I have done over years using my Google pay account and what are the things on which I have to cut down on future and how to better manage my expenses.
Downloaded Data
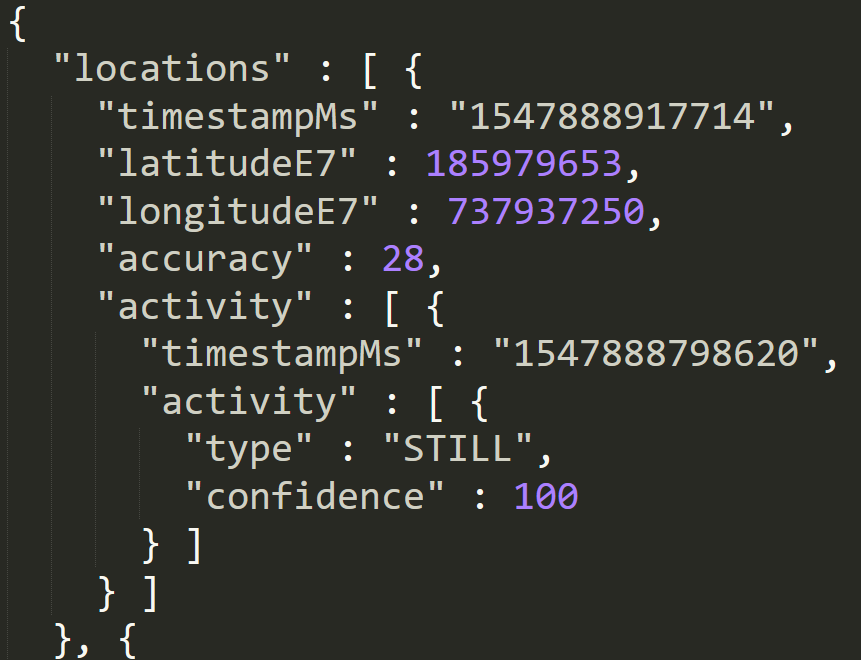
Downloaded Location data is in the form of JSON and it contains all the information for the places where you had been in these many years.
Few major data attributes that you see in this data are:
a) timestamps: milliseconds
b) latitudeE7: latitude of the place
c) longitudeE7: Longitude of the place
d) Activity: types: ON_FOOT
WALKING
IN_VEHICLE
ON_BICYCLE
RUNNING
IN_ROAD_VEHICLE
IN_RAIL_VEHICLE
etc.
Import Data into a Dataframe
import json
import datetime
latlist=[]
longlist=[]
dttime=[]
datafile="./takeout-20190119T104029Z-001/Takeout/Location History/LocationHistory.json"
file = open(datafile)
json_data=json.load(file)
for item in json_data['locations']:
    dttime.append(datetime.datetime.fromtimestamp(int(item['timestampMs'])/1000))
    latlist.append(round(item['latitudeE7']/10000000,2))
    longlist.append(round(item['longitudeE7']/10000000,2))

df=pd.DataFrame({'Date_Time':dttime,'Latitude':latlist,'Longitude':longlist})
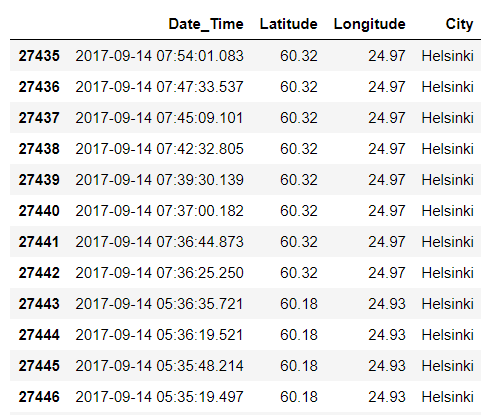
Filter Data for September’17
df=df[(df['Date_Time']>'2017-09-13')&(df['Date_Time']<'2017-09-16')]
Plot this Filtered Data on a Map
import folium
colors = {'A' : 'red', 'B' : 'blue'}

map_osm = folium.Map(location=[18.5979897, 73.7936107], zoom_start=11)

df.apply(lambda row:folium.CircleMarker(location=[latlist1, longlist1],
                                              radius=10, fill_color=colors[row['Class']], popup=row['Class'])
                                             .add_to(map_osm), axis=1)

map_osm
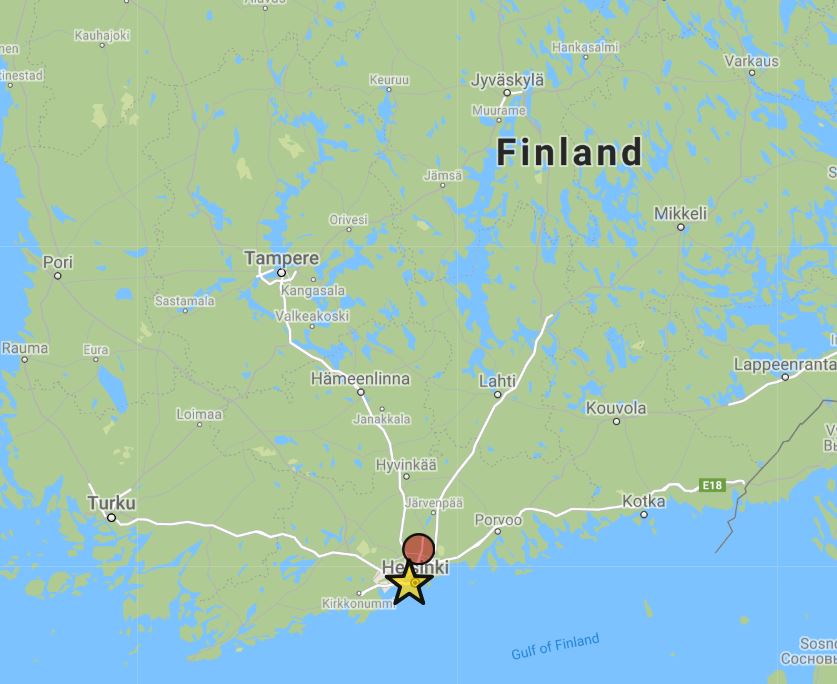
Voila! I was in Helsinki,Finland that month and Year for a Technical Conference and there you see how well it shows my data with date and time and accurate lat/long of the places where I had been to during my Stay in Helsinki,
Plot the Historical Data on a Map
The best way to visualize your data is to see that on Map (Use: https://locationhistoryvisualizer.com/heatmap/ if you are not well aware of coding that in Python using Basemap) and observe your activity throughout the yesteryear’s.
This is a Geo Heatmap that I have used to plot my places on the map to look through the area where I had been hanging around a lot, of course area around my Home and Workplace is shown as dense and highlighted in Red.
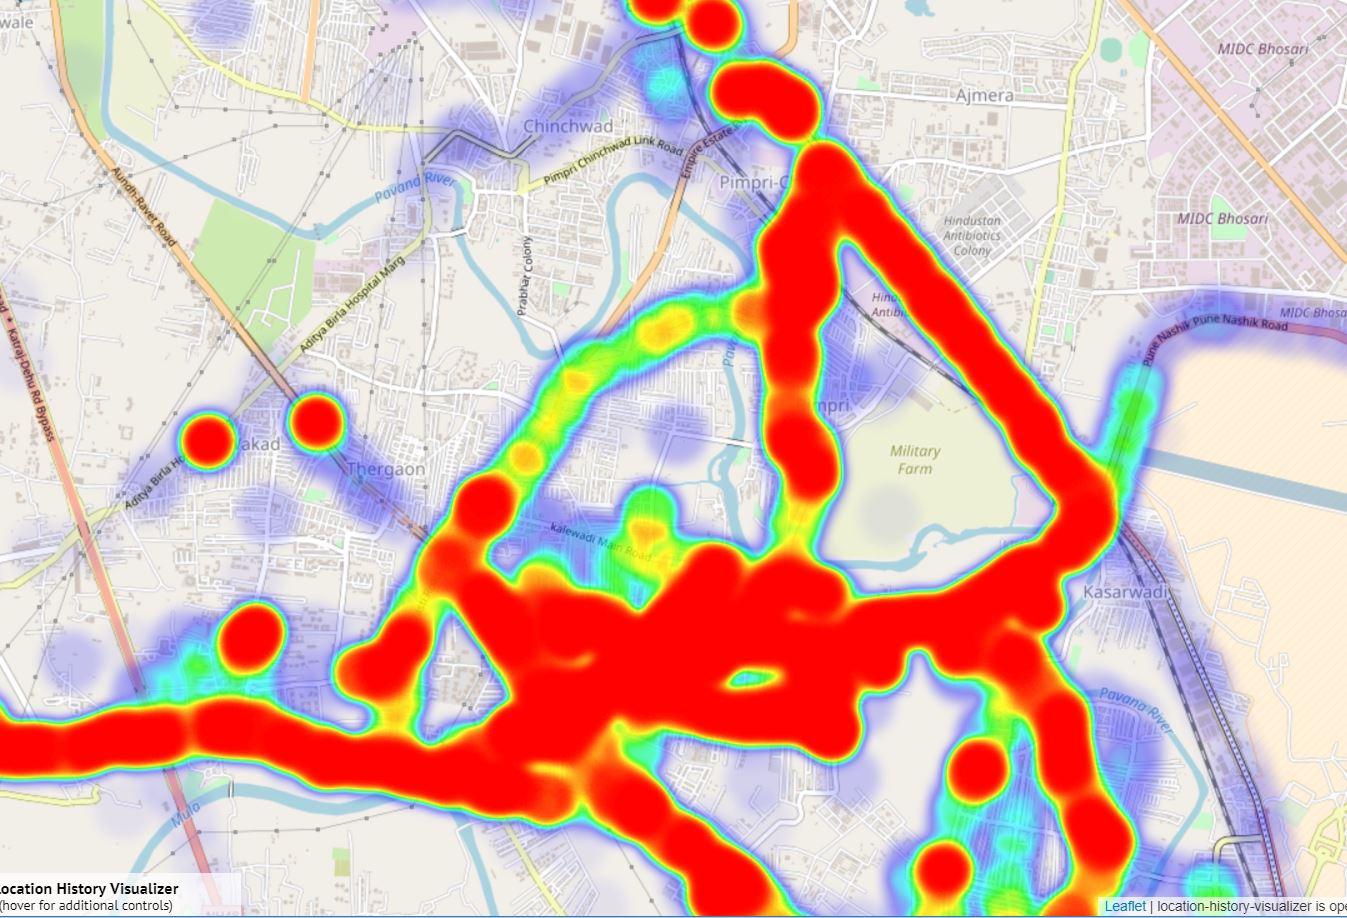
The patches in Red covers my Bike(cycling) path which is my routine exercise and that’s the place where I hang around a lot all year round compared to any other places in this world.
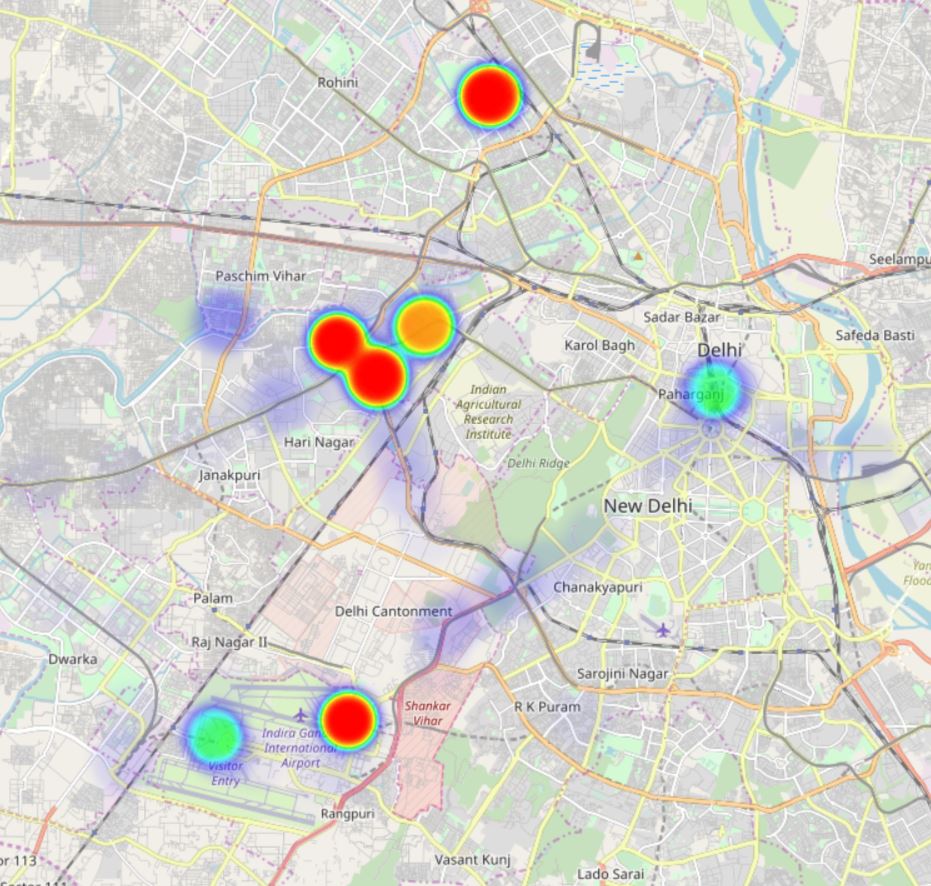
Finally, Some Visualizations shows that I was in the National Capital(New Delhi) also sometime last year for a wonderful and Cheering Vacation with my Family and spent a splendid week moving in and around Delhi and have visited Taj Mahal as well.
So how handy and simple it is to Visualize our data and memorize our past events. We owe google and it’s team a big time for storing our data and making it available to us whenever we need it. This data you can store in Google Drive as well and can download it anytime. The Data for Google Pay was in HTML format so you might need some web scrapping knowledge to pull the data from HTML pages and to run analytics around it.
Hope that will be fun for all of us looking at our past data and it’s Visualization to gain insight on lot of features which we can use to learn our past behaviour and reform our future actions.
Once again Thank You Google!!