How to shift a column in Pandas
If you want to shift your columns without re-writing the whole dataframe or you want to subtract the column value with the previous row value or if you want to find the cumulative sum without using cumsum() function or you want to shift the time index of your dataframe by Hour, Day, Week, Month or Year then to achieve all these tasks you can use pandas dataframe shift function. Here are the parameters that needs to be used with the shift function:
DataFrame.shift(self, periods=1, freq=None, axis=0, fill_value=None)
periods : a integer value, Number of periods to shift. it can be both positive and negative
freq : This can be used with DateOffset, tseries.offsets, timedelta, or str
axis : 0 if you want to shift index and 1 if you want to shift column
fill_value : It can be used to fill the newly introduced missing values
The function returns the shifted copy of the dataframe
Let’s understand the pandas shift() function and all it’s features using some examples
Create Dataframe
import pandas as pd
df = pd.DataFrame({'line_race': [10, 10, 8, 10, 10, 8],
                       'beyer': [99, 102, 103, 103, 88, 100],
                       'number1':[3,4,5,6,7,8],
                      'namet':['Last Gunfighter', 'Last Gunfighter',
                             'Last Gunfighter', 'Paynter', 'Paynter',
                             'Paynter']})
df
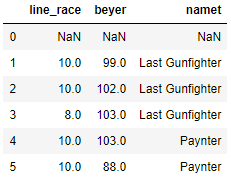
Pandas shift index by 1
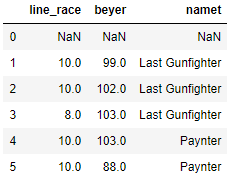
Here you can see the 0th index row value in original dataframe above is moved to the index 1 since we shifted by 1 and all the column values at index 0 is replaced with NaN.
Now you can try to give the period value as 2 and see. We have not passed any other parameters so there default value is taken.
df.shift(periods=1)
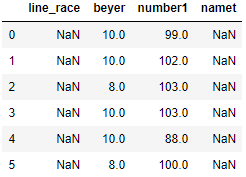
Now we will move the column value to the next column, So what I mean is the value of line_race should be shifted to next column beyer and beyer column value to number1 and column namet and line_race will not have any values to fill in. We will see how we can fill these NaN values with some common value
df.shift(periods=1,axis=1)
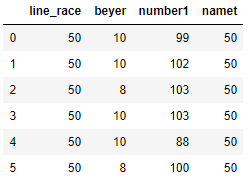
Pandas shift fill_value
Using the **fill_values** parameters we will fill all the missing values in column line_race and namet column in the above dataframe. Lets fill the missing values with integer 50 in two columns
df.shift(periods=1,axis=1,fill_value= 50)
Pandas dataframe difference between columns
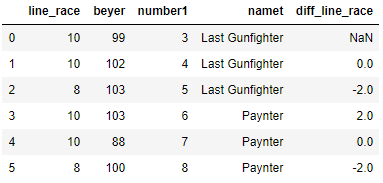
Lets see how to find difference with the previous row value, So here we want to find the consecutive row difference. First we will take the column line_race and see how it works and store the result to a new column called ‘diff_line_race’. The first value in diff_line_race is NaN and the second value is (10-10) = 0 and third value (8-10) = -2 and so on
df['diff_line_race'] = df['line_race'] - df['line_race'].shift(1)
df
Pandas groupby shift
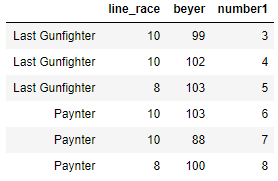
Lets see how the shift will work in a group by, So we will change our original dataframe a bit and will have this new dataframe.
df = pd.DataFrame({'line_race': [10, 10, 8, 10, 10, 8],
                       'beyer': [99, 102, 103, 103, 88, 100],
                       'number1':[3,4,5,6,7,8]},
                      index =['Last Gunfighter', 'Last Gunfighter',
                             'Last Gunfighter', 'Paynter', 'Paynter',
                             'Paynter'])
df
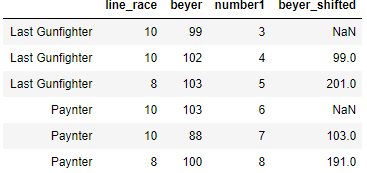
Now we want to do a cumulative sum on beyer column and shift the that value in each group by 1. So we will use transform to see the separate value for each group. Now you can see the new beyer_shifted column and the first value is null since we shift the values by 1 and then it is followed by cumulative sum 99, (99+102) i.e. 201 for group ‘Last Gunfighter’ and again for the group Paynter the first beyer_shifted value is null and then followed by the cumulative sum 103 and (103+88) i.e. 191
df['beyer_shifted'] = df.groupby(level=0)['beyer'].transform(lambda x: x.cumsum().shift())
df
Pandas Shift freq
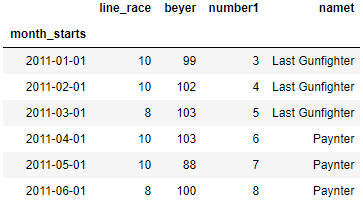
Freq is used to shift the time index, So to understand this lets create another dataframe with a time index, the index must be date or datetime, or it will raise a NotImplementedError, So month_start column is our new column with time index.
import pandas as pd
df = pd.DataFrame({'line_race': [10, 10, 8, 10, 10, 8],
'beyer': [99, 102, 103, 103, 88, 100],
'number1':[3,4,5,6,7,8],
'namet':['Last Gunfighter', 'Last Gunfighter',
'Last Gunfighter', 'Paynter', 'Paynter',
'Paynter']})
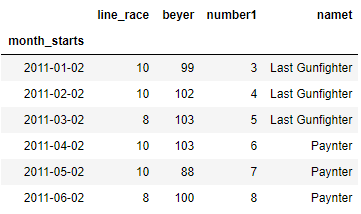
df['month_starts'] = pd.date_range('1/1/2011', periods=6, freq='MS')
df.set_index('month_starts',inplace=True)
df
Now we will use the freq parameter to shift this value in terms of hours, day, weeks and years. The value of period will be given in the same way as integer along with freq and it will shift the value based on the freq value. what does it mean is if freq is day and periods =1 then the value is shift by 1 day. Similarly, if the value of freq is month and periods =1 then it will move the index value by a month
In the below dataframe, the value of month_starts is shifted by 1 so if you look at the first index the original value was ‘2011-01-01’ and after the shift the value is changes to 2011-01-02 because our frequency was day and period was 1.
Now you can try to change the period by 2 or any other value and check if the date index is shifted by that period or not
df.shift(periods=1,freq='D')
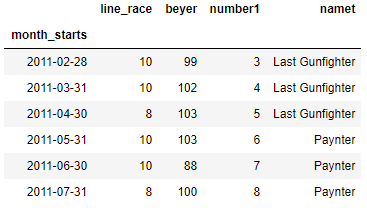
Lets take another value where we want to shift the index value by a month so we will give periods = 2 and freq = M. You can check the first index the original value 2011-01-01 is changed to 2011-02-28 since we shifted the value by 2 and frequency was month so it moved by two months i.e. equivalent to 60 days approx
df.shift(periods=2,freq='M')
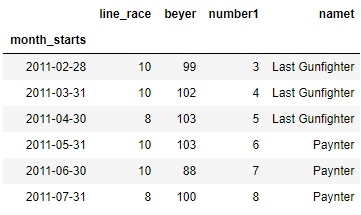
Pandas tshift
You can also use tshift i.e Shift the time index, using the index’s frequency if available
df.tshift(2,freq='M')
Conclusion
We have seen how shift() function can be used to achieve lot of tasks like finding difference between two columns or shifting a column in Pandas dataframe. As a next step, I would suggest to change the values of periods, frequency, fill_values and axis parameters and use it on different datatypes like numeric, categorical or time-series and see how it works.