How to Remove Outliers in Python
Introduction
Outliers are the values in dataset which standouts from the rest of the data. The outliers can be a result of error in reading, fault in the system, manual error or misreading
To understand outliers with the help of an example: If every student in a class scores less than or equal to 100 in an assignment but one student scores more than 100 in that exam then he is an outlier in the Assignment score for that class
For any analysis or statistical tests it’s must to remove the outliers from your data as part of data pre-processing
Any outlier in data may give a biased or invalid results which can impact your Analysis and further processing
In this post we will see following two robust methods to remove outliers from the data and Data Smoothing techniques using Exponential Weighted Moving Average
a) IQR - Interquartile Range
b) Z-Score method for Outlier Removal
Data Smoothing:
a) Exponential Weighted Moving Average
Inter Quartile Range (IQR)
IQR is part of Descriptive statistics and also called as midspead , middle 50%
IQR is first Quartile minus the Third Quartile (Q3-Q1)
In order to create Quartiles or Percentiles you first need to sort the data in ascending order and find the Q1,Q2,Q3 and Q4. Basically you have to divide the data in four equal parts after sorting
The middle value of this sorted data will be the median or Q2 or 50th Percentile
Let’s create our data first and then calculate the 1st and 3rd Quartile
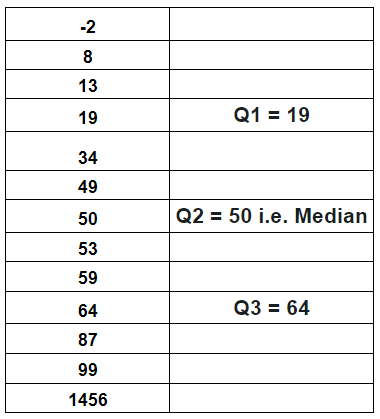
The Interquartile IQR for the above data is
IQR = Q3 - Q1 = 64 - 19 = 45
For finding out the Outlier using IQR we have to define a multiplier which is 1.5 ideally that will decide how far below Q1 and above Q3 will be considered as an Outlier.
Any value below Q1-1.5*IQR or above Q3+1.5*IQR is an Outlier
Q1 - 1.5*IQR = 19 - 1.5*45 = -48.5
Q3 + 1.5*IQR = 64 + 1.5*45 =  131.5
We will remove the last item in this dataset i.e. 1456 which is greater than 86.5
Finding IQR using Scipy
from scipy.stats import iqr
data = [-2,8,13,19,34,49,50,53,59,64,87,89,1456]
iqr(data, axis=0)
IQR = 45, which is same as above calculated manually
You can also use numpy to calculate the First and 3rd Quantile and then do Q3-Q1 to find IQR
import numpy as np
Q1 = np.quantile(data,0.25)
Q3 = np.quantile(data,0.75)
IQR = Q3 - Q1
Z-Score
Z score is an important measurement or score that tells how many Standard deviation above or below a number is from the mean of the dataset
Any positive Z score means the no. of standard deviation above the mean and a negative score means no. of standard deviation below the mean
Z score is calculate by subtracting each value with the mean of data and dividing it by standard deviation
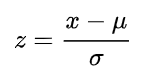
The Mu and Sigma above is population mean and Standard deviation and not of sample
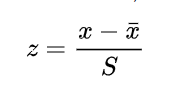
In case population mean and standrad deviation is not known then sample mean and standard deviation can be used
Let’s calculate the Z score of all the values in the dataset which is used above using scipy zscore function
Finding Z-score using Scipy
import pandas as pd
from scipy import stats
df=pd.DataFrame({'data':[-2,8,13,19,34,49,50,53,59,64,87,89,1456]})
df['z_score']=stats.zscore(df['data'])
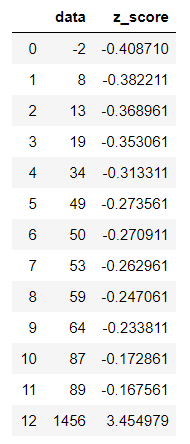
These are the respective z-score for each of these values. You can see almost all of them have a negative value except the last one which clearly indicates that most of these values lies on the left side of the mean and are within a range of mean and mean-stddev
Now as per the empirical rule any absolute value of z-score above 3 is considered as an Outlier. This is quite debatable and may not hold true for every dataset in this world.
df.loc[df['z_score'].abs()<=3]
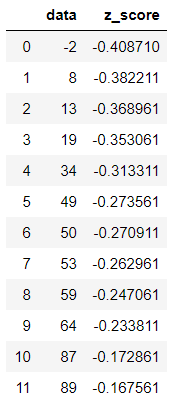
But that’s in-line with the six sigma and statistical process control limits as well. So we have discarded any values which is above 3 values of Standard deviation to remove outliers
In this case only z score which is above 3 is 1456. so that clearly stands out as an outlier
Data Smoothing
Smoothing of data is done for a variety of reasons and one of them is eliminating the spikes and outliers. You can use various techniques like rolling mean, moving averages and Exponential smoothing(EWMA)
if you have some outliers which are really high or a absolute low then smoothing helps to summarize the data and remove the noise from the data
We will discuss Exponential Smoothing(EWMA) unlike moving average which doesn’t treat all the data points equally while smoothing. Most of the time in a Time series data we want to treat the most recent data with more weight than the previous data
In EWMA we are weighting the more recent points higher than the lags or lesser recent points
For a time period t the smoothed value using exponential smoothing is given by following equation. Source: wikipedia link
The value alpha in this equation is the smoothing factor which is a kind of decides that how much the value is updated from the original value versus retaining information from the existing average
For example: if your current value if 12 and previous value is 8 and smoothing level is 0.6 then the smoothed value is given by
12*0.6 + (1-0.6)*8
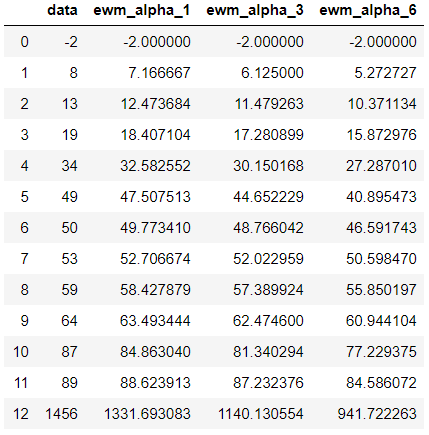
Finding Exponential Smoothing values using Pandas
Pandas has a EWM function which you can use to calculate the smoothed value with different level of Alpha
df['ewm_alpha_1']=df['data'].ewm(alpha=0.1).mean()
df['ewm_alpha_3']=df['data'].ewm(alpha=0.3).mean()
df['ewm_alpha_6']=df['data'].ewm(alpha=0.6).mean()
df
Conclusion
To sumarize our learning here are the key points that we discussed in this post
- Outliers can be removed from the data using statistical methods of IQR, Z-Score and Data Smoothing
- For claculating IQR of a dataset first calculate it’s 1st Quartile(Q1) and 3rd Quartile(Q3) i.e. 25th and 75 percentile of the data and then subtract Q1 from Q3
- Z-Score tells how far a point is from the mean of dataset in terms of standard deviation
- An absolute value of z score which is above 3 is termed as an outlier
- Data smoothing is a process to remove the spikes and peaks from the data
- Moving Average, Rolling Mean and Exponential smoothing are some of the process to smooth the data
- Pandas Exponential smoothing function (EWM) can be used to calculate the value at different alpha level
Hope you must have got enough insight on how to use these methods to remove outlier from your data. if you know of any other methods to eliminate the outliers then please let us know in the comments section below