Show images in grid inside jupyter notebook using matplotlib and numpy
In this post, we will see how to display the images in a grid using matplotlib imshow and Image grid. Alternatively, we will see the visualization of image blocks and show it in a grid using numpy
This entire exercise is done using a jupyter notebook, so it may be useful for someone who would like to visualize their images in a grid format inside a cell of Jupyter notebook.
These are three ways that will be demonstrated in this post for displaying the images in grid
- Matplotlib imshow
- Matplotlib Image Grid
- Numpy
Let’s get started, first we will define a function to load and resize the images and convert that into a numpy array
import matplotlib.pyplot as plt
import numpy as np
import os
from PIL import Image


def img_reshape(img):
    img = Image.open('./images/'+img).convert('RGB')
    img = img.resize((300,300))
    img = np.asarray(img)
    return img
Sample Image
Let’s see a sample image using the above method img_reshape(), before that let’s create the array of all the image data so it will be easier to iterate and choose an image from the list
images = os.listdir('./images')
img_arr = []

for image in images:
    img_arr.append(img_reshape(image))
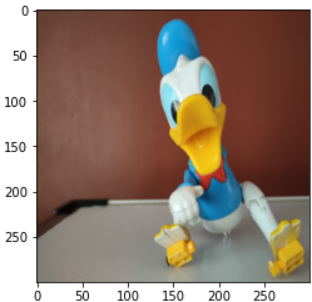
Now we have an img_arr that contains all the available image data, Let’s display an image from this list and see how our sample image looks like
pil_im = img_reshape('img4.jpg')
plt.imshow(np.asarray(pil_im))
Show mutliple images using matplotlib imshow
Let’s take first four images and display that in a 2x2 grid, first we have to create a subplot with nrows = 2 and ncols = 2 and set a figure size of 15, 15. The variable img_count is used to iterate through the image index in the array(img_arr) created above
rows=2
cols = 2
img_count = 0

fig, axes = plt.subplots(nrows=rows, ncols=cols, figsize=(15,15))

for i in range(rows):
    for j in range(cols):
        if img_count < len(images):
            axes[i, j].imshow(img_dict[img_count])
            img_count+=1
This will display the first four images in a 2x2 grid as shown in this figure
Matplotlib Image grid
It’s a class that creates grids of axes, we can align multiple images of different size using it, The ImageGrid() function here will take the following four arguments:
- fig - It’s the parent figure for displaying images
- rect - This will set the axes position as
(left, bottom, width, height)tuple or as a three-digit subplot position code, it’s 111 in our case - nrows_ncols - number of rows and cols, the shape of the grid, it’s 2x2 in our case here
- axes - Horizontal or Vertical padding between axes in inches
import matplotlib.pyplot as plt
from mpl_toolkits.axes_grid1 import ImageGrid
import numpy as np
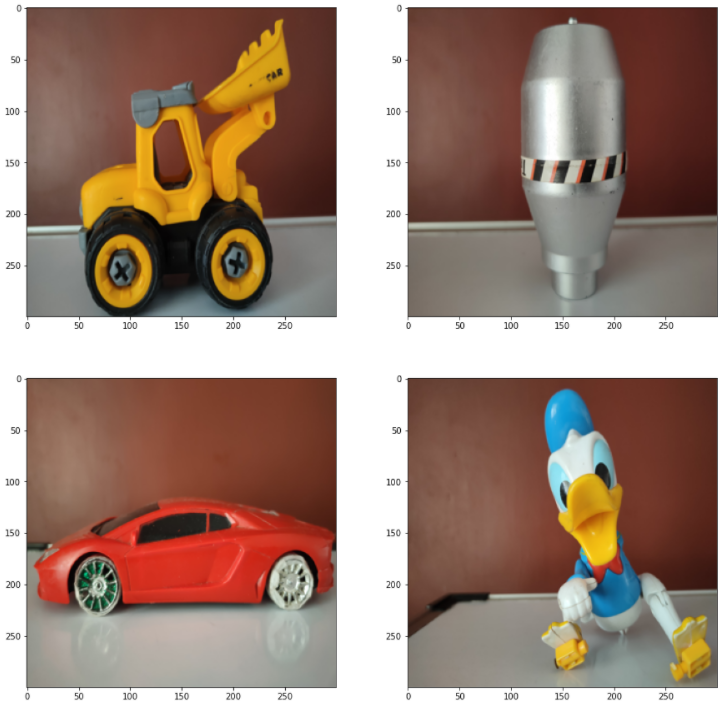
fig = plt.figure(figsize=(20., 20.))
grid = ImageGrid(fig, 111,
nrows_ncols=(2, 2), # creates 2x2 grid of axes
axes_pad=0.1, # pad between axes
)
for ax, im in zip(grid, img_arr):
ax.imshow(im)
plt.show()
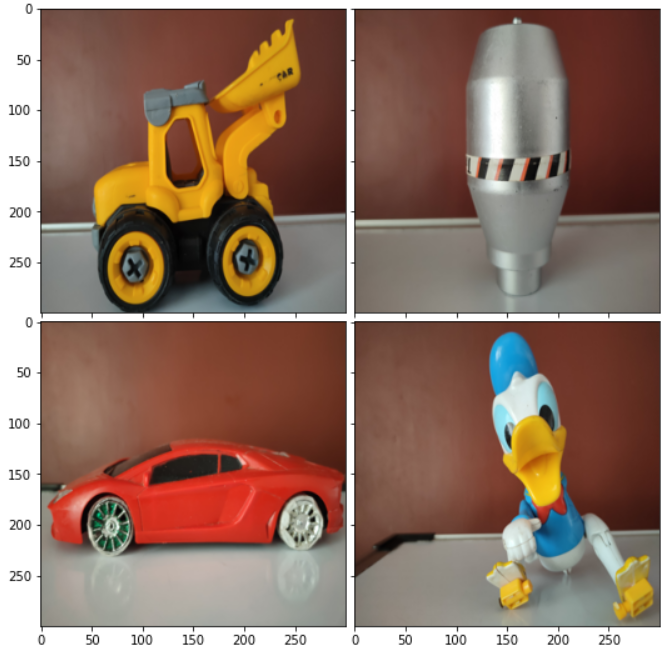
Image grid using numpy
Let’s display all our images in a 2x4 grid using numpy, we will use the image array(img_arr) created above and then we will create a function that takes image array and number of columns as second argument
Inside the function, the image array will be reshaped and split the first axes into two axes, one of length nrows and one of length ncols. Then swapaxes(1,2) to reorder the axes
def image_grid(array, ncols=4):
    index, height, width, channels = array.shape
    nrows = index//ncols

    img_grid = (array.reshape(nrows, ncols, height, width, channels)
              .swapaxes(1,2)
              .reshape(height*nrows, width*ncols))

    return img_grid

result = image_grid(np.array(img_arr))
fig = plt.figure(figsize=(20., 20.))
plt.imshow(result)
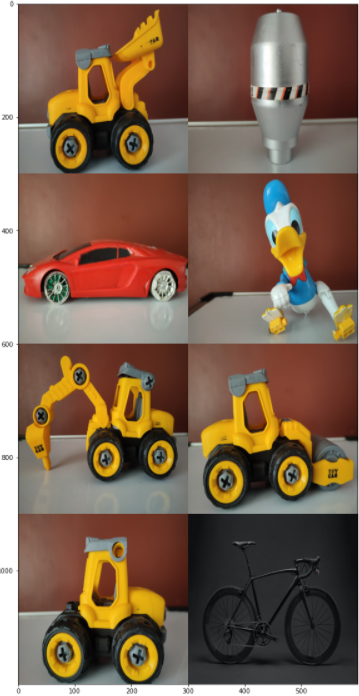
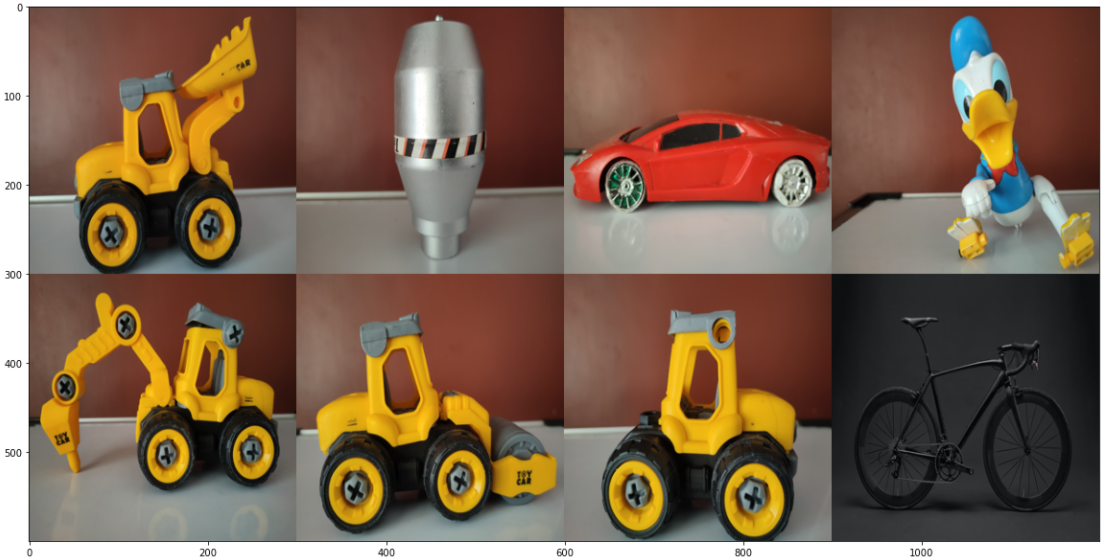
Here is the output for a 2x4 and 4x2 grid using numpy
2x4 grid:
4x2 grid: