pandas groupby filter by column values and conditional aggregation
In this post, we will learn how to filter column values in a pandas group by and apply conditional aggregations such as sum, count, average etc.
We will first create a dataframe of 4 columns , first column is continent, second is country and third & fourth column represents their GDP value in trillion and Member of G20 group respectively. These are fake numbers and doesn’t represent their real GDP worth.
Once this dataframe is created then we will group the countries in this dataframe that are in the same continent and apply conditions to determine the GDP sum of countries who are Member of G20 and who aren’t.
Create a test dataframe
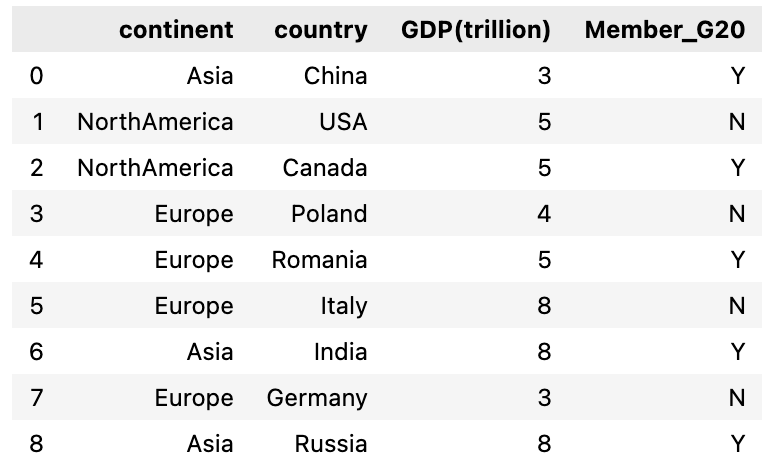
Let’s create a dataframe with all the four columns: continent, country, GDP(trillion) and Member_G20
For the third column GDP(trillion), I’m using numpy randint function to create random numbers for all these countries and similarly for fourth column(Member_G20) random choice is used to randomly select from the list [‘Yes’, ‘No’]
import pandas as pd
import numpy as np

df = pd.DataFrame({'continent' : ['Asia','NorthAmerica','NorthAmerica','Europe','Europe', 'Europe','Asia', 'Europe', 'Asia'],
               'country' : ['China', 'USA', 'Canada', 'Poland', 'Romania', 'Italy', 'India', 'Germany', 'Russia'],
               'GDP(trillion)' : np.random.randint(1, 9 , 9),
               'Member_G20' : np.random.choice(['Y', 'N'], 9)})
Groupby continent and sum the GDP of countries who are G20 Member
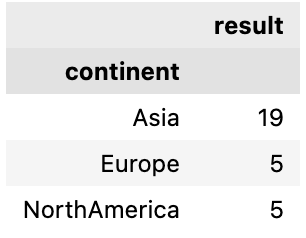
So we will first group by continent and then filter the rows in each group where a country is a G20 member
df.groupby(['continent']).apply(lambda x: x[x['Member_G20'] == 'Y' ]['GDP(trillion)'].sum())
Output:
continent
Asia            19
Europe           5
NorthAmerica     5
dtype: int64
Let’s understand this by doing one step at a time:
First we group by continent using pandas groupby function
grp=df.groupby(['continent'])
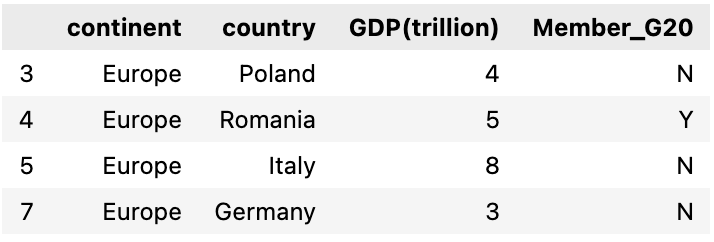
Next, we will select a group from this groupby result, we will choose Europe. we can see all the rows within the group Europe and there are 3 countries in Europe that are not a G20 member
selected_group = grp.get_group('Europe')
selected_group
Now filter the rows by column Member_G20 and drop all countries that are not a G20 Member
selected_group[selected_group['Member_G20']=='Y']
Output
     continent	 country	    GDP(trillion)	  Member_G20
4	 Europe	    Romania	        5	           Y
At last, we will get the GDP(trillion) column for this filtered group and compute it’ sum
selected_group[selected_group['Member_G20']=='Y']['GDP(trillion)'].sum()
Output
5
Using pandas assign to filter the groupby columns and apply conditional sum
We can use pandas assign, which adds a new column in the dataframe to filter it first by the column values and then apply pandas groupby and finally aggregate the values. Let’s see how it works
here we are using pandas assign to create a new column and update it by column value GDP(trillion) using numpy where() to filter the rows where country is a G20 member otherwise update with 0
df.assign(result = np.where(df['Member_G20']=='Y',df['GDP(trillion)'],0))\
   .groupby('continent').agg({'result':sum})
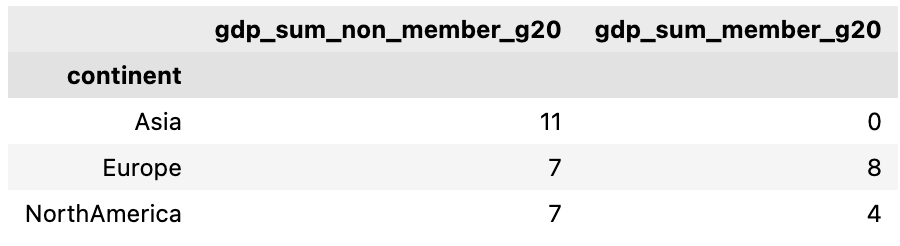
Let’s take another example, if we want to sum up the GDP(trillion) value of the countries who are not a G20 member and also who are a G20 member. We will create two columns in this case and then apply groupby and aggregate(sum) values
df.assign(
 gdp_sum_non_member_g20 = np.where(df['Member_G20']=='N',df['GDP(trillion)'],0),
 gdp_sum_member_g20 = np.where(df['Member_G20']=='Y',df['GDP(trillion)'],0)
  ).groupby('continent').agg({'gdp_sum_non_member_g20':sum, 'gdp_sum_member_g20':sum})