Matplotlib xticks every hour and every 15 or 30 minutes starting on the hour
In this post we will see how to use mataplotlib xticks locators and formatters to place the ticks every hour or every 15/30 minutes on a plot.
we will use the two relevant matplotlib classes locators and formatters. Locators determine where the ticks are, and formatters control the formatting of tick labels.
Here are the steps that we are following in this post:
- Create a dataframe with datetime index
- Use
matplotlib.dates.HourLocatorto place the xticks after every hour - Use matplotlib
Axis.set_major_locatorandAxis.set_major_formatterto place the ticks and format it respectively. - We are going to place the minor ticks after every 15 minutes within in a hour
- Will create the customize ticks after every 45 minutes instead of every hour
- Place the ticks after every 30 mins between each hour locators
- Set the x limit for the left and right ticks
Create Dataframe
Let’s create a series of date range with datetime index and frequency every minute
idx = pd.date_range('2017-01-01 05:03', '2017-01-01 10:49', freq = 'min')

df = pd.Series(np.random.randn(len(idx)),  index = idx)
df
Out:
2017-01-01 05:03:00    0.709453
2017-01-01 05:04:00    0.092573
2017-01-01 05:05:00    3.670494
2017-01-01 05:06:00   -0.434268
2017-01-01 05:07:00   -1.483753
Freq: T, dtype: float64
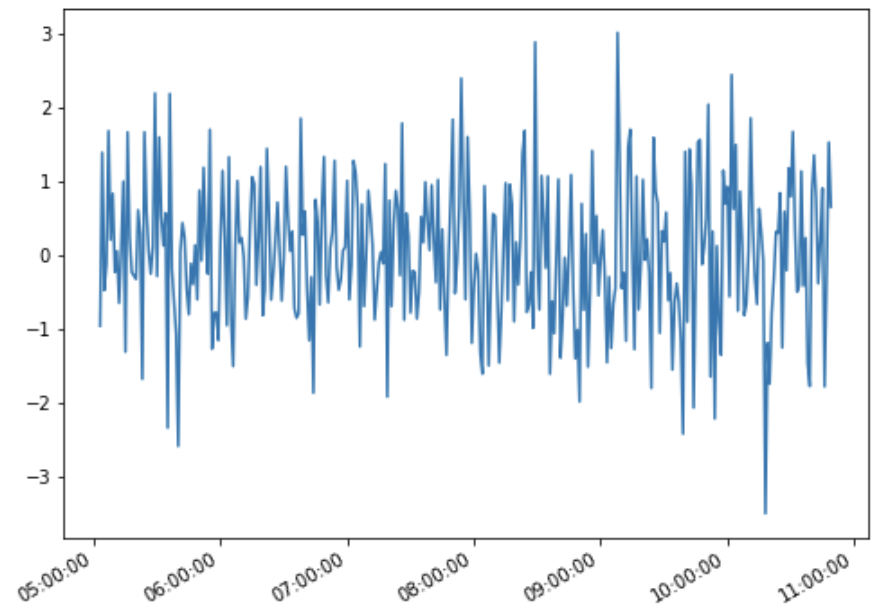
Ticks every hour
We want to place the xticks after every hour in the x-axis, so we will use matplotlib.dates.HourLocator()class to make ticks on occurence of each hour. We are using the interval parameter as 1 to set the interval to 1 hour between each iteration
Axis.set_major_locator sets the locator of the major ticker, which are hours here
And the Axis.set_major_formatter set the formatter of the major ticker. The formatters control the formatting of tick labels
The autofmt_xdate is a helpful function to prevent overlapping of dates or to rotate and right align the labels
import matplotlib.pyplot as plt
import matplotlib.dates as md

fig, ax = plt.subplots(figsize=(8,6))

# plot
plt.plot(df.index, df.value)

# major locator
xloc=md.HourLocator(interval = 1)
ax.xaxis.set_major_locator(xloc)

# major formatter
majorFmt = md.DateFormatter('%H:%M:%S')
ax.xaxis.set_major_formatter(majorFmt)

# auto-format
fig.autofmt_xdate()

plt.show()
Out:
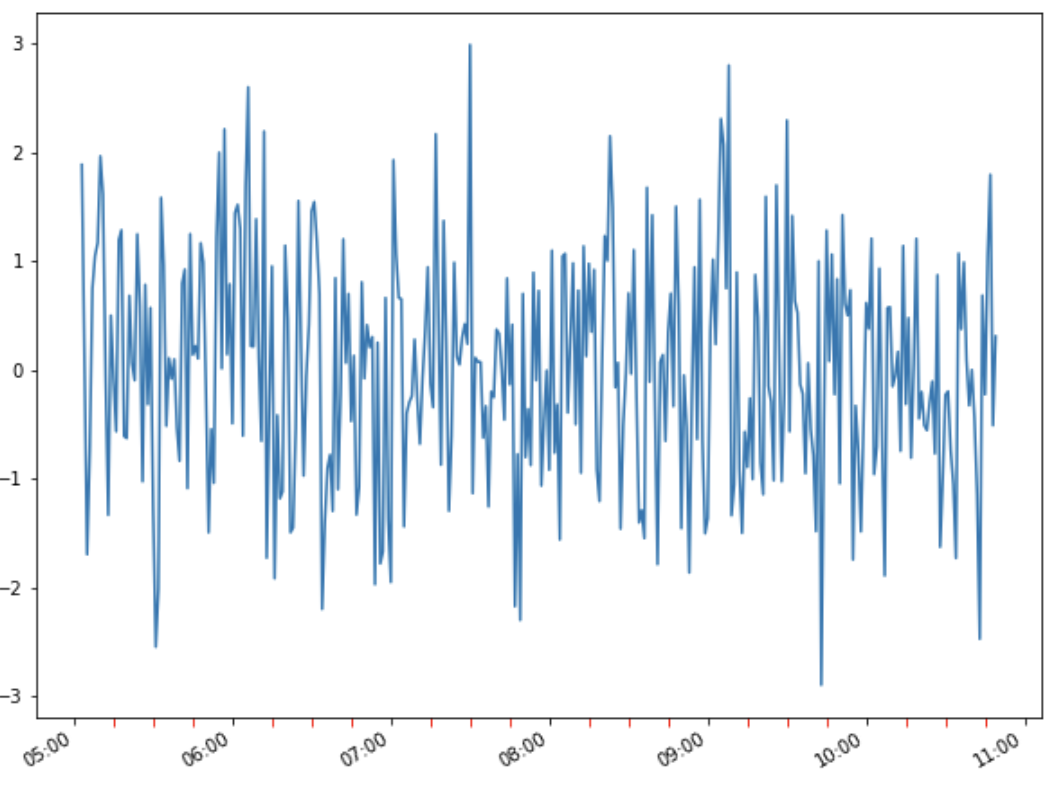
Ticks every 15 minutes, starting on the hour
In our above hour ticks plot we will place the minor ticks after every 15 minutes, which is shown in red in the below plot.
We’ve used the Axis.minor_locator to set the ticks after 15 mins and AutoMinorLocator to decide the best split between two major ticks
The tick_params will let you customize the minor or major ticks color, length and width
## Hour locator - show minor locator with 15 mins frequency
import matplotlib.pyplot as plt
import matplotlib.dates as md
from matplotlib.ticker import AutoMinorLocator

fig, ax = plt.subplots(figsize=(10,8))

# plot
plt.plot(df.index, df.values)

# major formatter
majorFmt = md.DateFormatter('%H:%M')
ax.xaxis.set_major_formatter(majorFmt)

# major locator
xloc=md.HourLocator(interval = 1)
ax.xaxis.set_major_locator(xloc)

# minor locator
ax.xaxis.set_minor_locator(AutoMinorLocator())

# customize the ticks - color, length and width
ax.tick_params(which='minor', length=5, width=1,color='red')

# auto-format
fig.autofmt_xdate()

plt.show()
Out:
You can see those red minor ticks between the two major ticks on x-axis, those are the ticks after every 15 minutes duration
To place the minor labels we can use Axis.set_minor_formatter
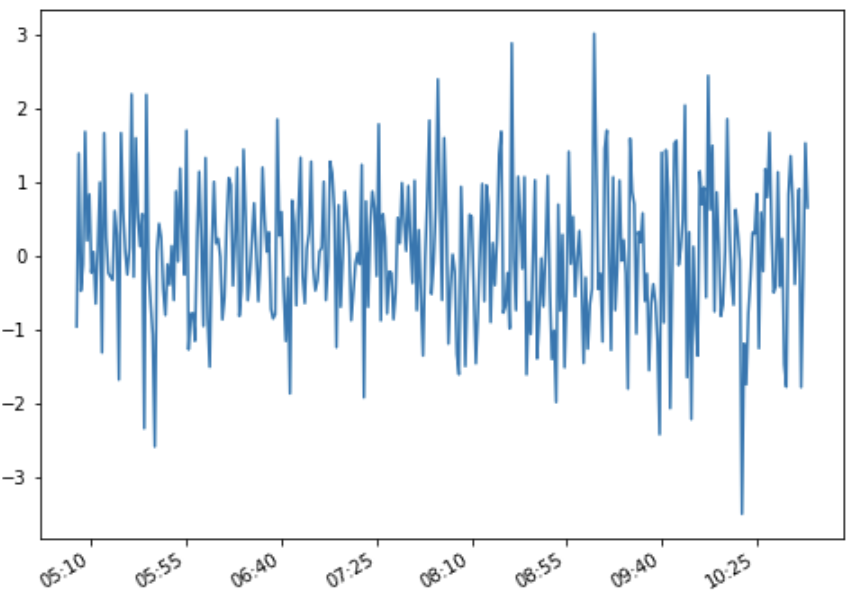
Ticks every 45 mins - xlim not setup
Let’s customize the hour ticks to have ticks after every 45 minutes, we will use Axis.Minutelocator for this to make ticks on occurrences of specified minute
The interval parameter decides the interval between each iteration which is set to 45, so that every 45th occurence in the Minute is marked.
We are not specifying the xlimits so the best tick labels are decided by the matplotlib
# hour - frequency 45 mins - Matplotlib decide the best split for you
import matplotlib.pyplot as plt
import matplotlib.dates as md

fig, ax = plt.subplots(figsize=(8,6))

# plot
plt.plot(df.index, df.values)

# major formatter
majorFmt = md.DateFormatter('%H:%M')
ax.xaxis.set_major_formatter(majorFmt)

# major locator
xloc=md.MinuteLocator(interval = 45)
ax.xaxis.set_major_locator(xloc)

# print to see the x-axis limits
print('left: ', md.num2date(ax.get_xlim()[0]), 'right: ', md.num2date(ax.get_xlim()[1]))

# auto-format
fig.autofmt_xdate()

plt.show()
Out:
The ticks shown are at an interval of 45 minutes and the left and right limit of x-xis is fetched using the Axis.get_xlim() function
 left:  2017-01-01 04:45:42+00:00
right:  2017-01-01 11:06:18+00:00
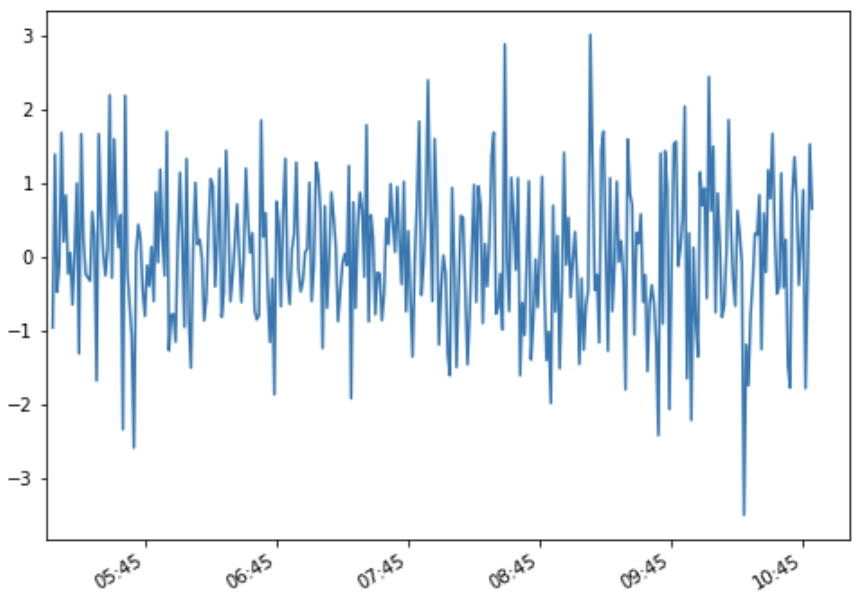
Ticks every 45 mins - xlim is setup
In the above plot we have seen the visible ticks are starting at 05:10 which is not something we want, we are looking for more elegant and meaningful tick labels
We will use Axis.set_xlim() to set the left limit of the x-axis and let it start at 05:00 Hrs and the next tick will be 05:45 and so on. I have subtracted 3 minutes from the left xlim to make it start at 05:00 and NOT 05:03
We are using byminute parameter of matplotlib.dates.MinuteLocator() function to place the ticks on every minutes in byminutes.
## Hour locator - Customize - every 45 mins
import matplotlib.pyplot as plt
import matplotlib.dates as md

fig, ax = plt.subplots(figsize=(8,6))

# plot
plt.plot(df.index, df.values)

# major formatter
majorFmt = md.DateFormatter('%H:%M')
ax.xaxis.set_major_formatter(majorFmt)

# major locator
xloc=md.MinuteLocator(byminute = 45)
ax.xaxis.set_major_locator(xloc)

# set the x-lim left limits
ax.set_xlim(left=df.index.min()-pd.Timedelta(3, unit='minutes'))

# print to see the x-axis limits
print('left: ', md.num2date(ax.get_xlim()[0]), 'right: ', md.num2date(ax.get_xlim()[1]))

# auto-format
fig.autofmt_xdate()

plt.show()
Out:
The x-lim starts at 05:00 and places the ticks more meaningfully after every 45 minutes
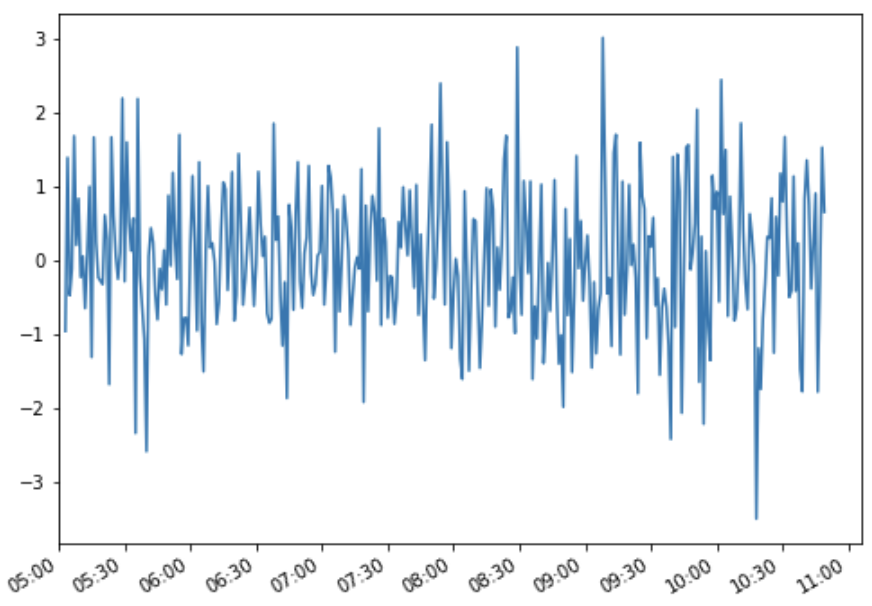
Ticks every 30 mins between the major Hour ticks
We want to place the ticks between two hours after 30 mins, we will use the byminutes parameter and pass the list of minutes [0, 30, 60] where we want to place the ticks
## Hour locator - after every 30 mins
import matplotlib.pyplot as plt
import matplotlib.dates as md

fig, ax = plt.subplots(figsize=(8,6))

# plot
plt.plot(df.index, df.values)

# major formatter
majorFmt = md.DateFormatter('%H:%M')
ax.xaxis.set_major_formatter(majorFmt)

# major locator
xloc=md.MinuteLocator(byminute = [0, 30, 60])
ax.xaxis.set_major_locator(xloc)

# set the x-lim left limits
ax.set_xlim(left=df.index.min()-pd.Timedelta(3, unit='minutes'))

# print to see the x-axis limits
print('left: ', md.num2date(ax.get_xlim()[0]), 'right: ', md.num2date(ax.get_xlim()[1]))

# auto-format
fig.autofmt_xdate()

plt.show()
Out:
left :  2017-01-01 05:00:00+00:00
right:  2017-01-01 11:06:18+00:00
Conclusion:
Here is the summary of what we have learned in this post:
matplotlib.dates.HourLocatoris used to mark the ticks on occurence of each hourAxis.set_minor_locatoris used to set the minor locators within major hour locators andmatplotlib.ticker.AutoMinorLocatorsubdivides the major tick interval into a specified number of minor intervalAxis.set_major_locatorandAxis.set_major_formatterare used to locate and format the ticks on axismatplotlib.dates.MinuteLocatoris used to mark the ticks on occurence of each minute and parameterbyminuteis used to place the ticks on every minutes in byminutes, whereas the interval parameter is used to mark the ticks between each iterationAxis.set_xlimis used to set the left and right limit of the axes in a plot- Axis.get_xlim() returns the epoc limit of the x-axis and it could be converted to date using
matplotlib.dates.num2datefunction